IOSTBTC is creating a pennant 🦐IOSTBTC is creating a pennant below the weekly resistance. IF the price is going to have a breakout, According to Plancton's strategy (check our Academy ), we can set a nice order
–––––
Follow the Shrimp 🦐
Keep in mind.
🟣 Purple structure -> Monthly structure.
🔴 Red structure -> Weekly structure.
🔵 Blue structure -> Daily structure.
🟡 Yellow structure -> 4h structure.
⚫️ Black structure -> <4h structure.
IOSTBTC trade ideas

IOST/BTC buy opportunityHi followers,
maybe bottomed on the 23 Jun, 2021, as since then the pair formed an impulsive move, which followed by triangle correction, which now seems to be broken to the up side.
This behavior suggests higher highs soon.
Don't forget to manage your risk! 👌
Good luck and trade with care 🙏
If you like my content - 👍 Like, 💬 comment, 👆 follow and 👉 share!
❗❗❗
Disclaimer: This information is not a recommendation to BUY or SELL. It is to be used for educational purposes only!

IOST/BTC { IOST } - BULLISH SETUPANALYSIS 🔎
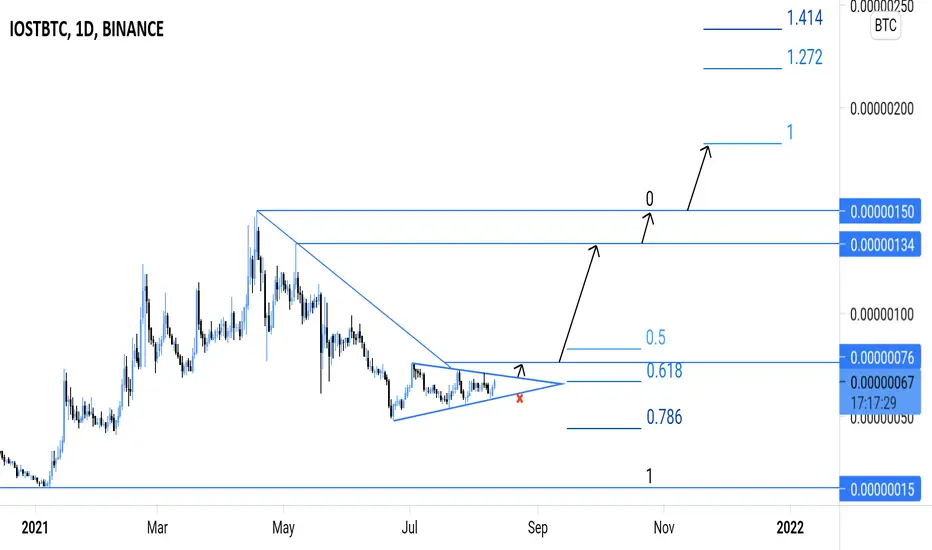
- IOST/BTC hit a swing high (@0.00000150) and retraced for a retest of the key fibonacci retracement zone (0.5 - 0.618 - 0.786).
- There was a relatively high concentration of buyers at the retest zone.
- The retracement was resisted by the descending trendline resistance.
- Price brokeout above the descending trendline resistance.
- This is a bullish signal.
- Price action is printing an pennant pattern.
- There's a breakout potential.
BUY ENTRY ⬆️
- Market entry: current market price.
- Stop limit entry: breakout above the pennant pattern's horizontal resistance.
- Limit entry: test of the pennant pattern's inclined support.
TARGETS 🎯
- Horizontal resistance level (@0.00000076).
- Horizontal resistance level (@0.00000134).
- Horizontal resistance level (@0.00000150)
- Fibonacci extension levels.
SETUP INVALIDATION ❌
- Initial invalidation: breakdown below the pennant pattern's inclined support.
- Final invalidation: breakdown below the 0.786 fibonacci retracement level.


IOST Trend Looks like IOST is moving in that price channel,it hit the lower trendline and now it could bounce back up, noticed that 46 RSI level is acting as support in this bull run. Watch the 59.70 RSI level as it shows resistance.


IOST - Daily AnalysisEntry : below 118
Target : 194 - 213
Average Profit : about 70 %
risk-reward ratio : about 3
==================================================================
This is not financial advice
Sincerely, Little Bob


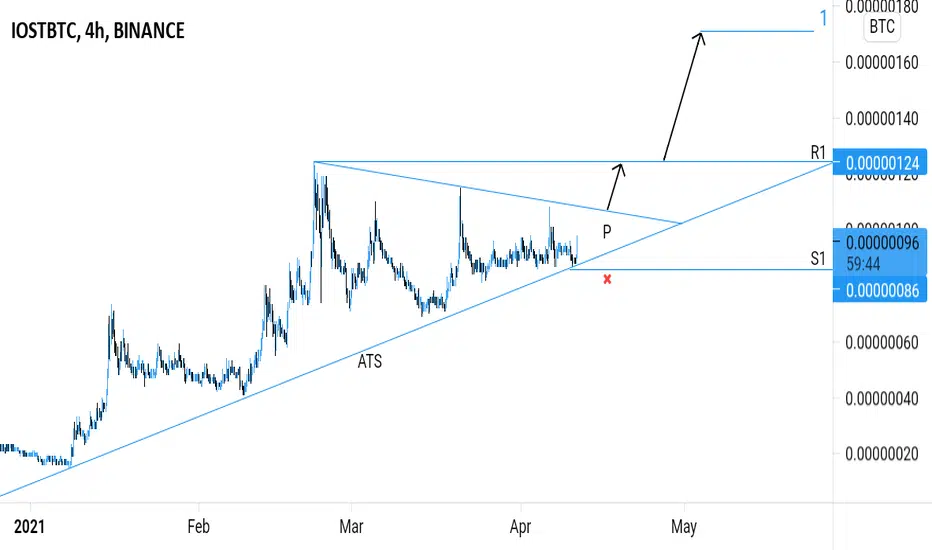
IOSTBTC (IOST) - BULLISH SETUP ANALYSIS 🔎
- IOSTBTC has been on a mid-term uptrend.
- The uptrend is supported by the ascending trendline support (ATS).
- Price is testing the ascending trendline support.
- Price action is printing a pennant (P) pattern.
- A pennant pattern is a trend continuation pattern.
- A bullish continuation pattern in this case.
- There's a breakout potential.
BUY ENTRY ⬆️
- Conservative entry : breakout above the pennant pattern's inclined resistance.
- Aggressive entry : current market price (CMP).
TARGETS 🎯
- Horizontal resistance level (R1).
- Fibonacci extension levels.
SETUP INVALIDATION ❌
- Breakdown below the pennant pattern's inclined support, ascending trendline support and the horizontal support level (S1).

IOSTBTC sHORTNote: Above idea is for educational purpose only. It is advised to diversify and strictly follow the stop loss, and don't get stuck with trade.

IOSTBTC - Pump soon / Dump first ?! Not financial advice but someone sharing his trading diary! - Make your own plans and you will do fine in the long run.
This chart might indicate signs of reversal soon - Based on fibs and fibs.
Scenario 1: A breakout happens, then FOMO long :)
Scenario 2: IOST offers a nice pullback into weekly / 618 levels
Target is a global 618 Retracement / Local 1.618 Extension / Monthly level.
- Taking profits along the way never hurt :)
- Invalidation is down below (chart) -> still can be a good risk reward if ladder long / Final target gets hit.
--
Trading level by level and Risking 1% of the account
#iost #iostbtc #technicalanalysis #crypto #altcoin


IOST/BTC Inverse Head and ShouldersIOST BTC pair forming daily inverse head and shoulders off the Ichimoku Kumo cloud and 2 big buy signals before.
I'd expect it to complete the IHS, break out and push to the measured move of ~77%@66sats


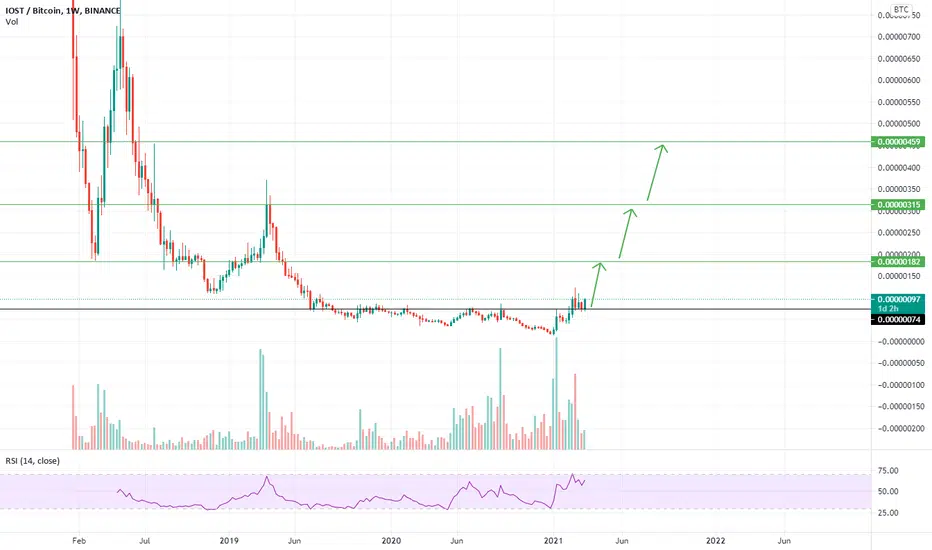
IOST is ready 🚀🚀 if you zoom out you can look that IOST has a lot of room to grow against bitcoin, and is getting started
Whit the MACD and the RSI stochastic we can see that the trend reversing will be confirmed
IOST has a ton of institutional partenrships and a totally new Proof of Believability that makes the fundamentals insainly bullish
You're still early to join the run
What you guys think of it?
