There is another opportunity to buy in IOSTBTCTechnical analysis:
. IOStoken/Bitcoin is in a range bound and the beginning of uptrend is expected.
. The price is below the 21-Day WEMA which acts as a dynamic resistance.
. The RSI is at 39.
Trading suggestion:
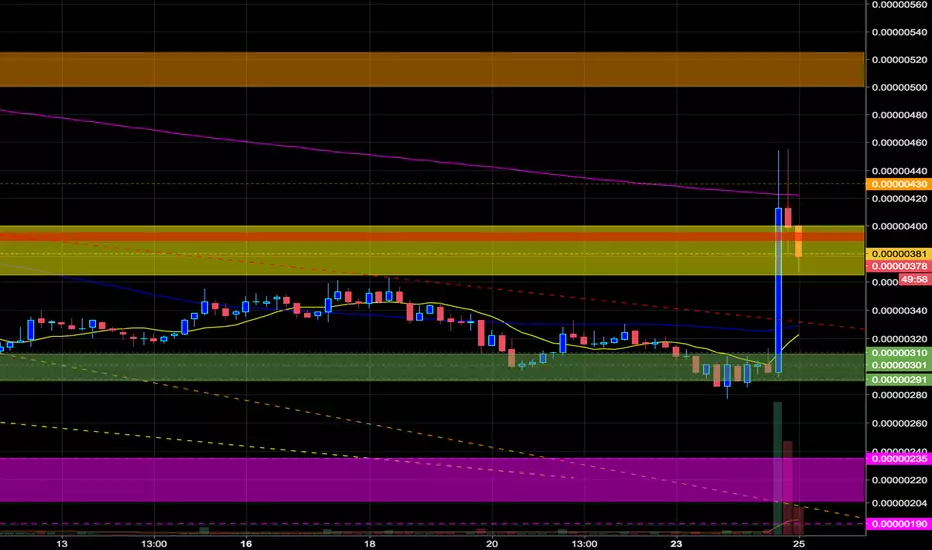
. Price is in the support zone (0.00000302 to 0.00000278), traders can set orders based on Daily-Trading-Opportunities and expect to reach short-term targets.
Beginning of entry zone (0.00000302)
Ending of entry zone (0.00000278)
Entry signal:
Signal to enter the market occurs when the price comes to "Buy zone" then forms one of the reversal patterns, whether "Bullish Engulfing" , "Hammer" or "Valley" in other words,
NO entry signal when the price comes to the zone BUT after any of the reversal patterns is formed in the zone.
To learn more about "Entry signal" and the special version of our "Price Action" strategy FOLLOW our lessons:
Take Profits:
TP1= @ 0.00000356
TP2= @ 0.00000374
TP3= @ 0.00000402
TP4= @ 0.00000421
TP5= @ 0.00000486
TP6= @ 0.00000592
TP7= @ 0.00000764
TP8= Free
IOSTBTC trade ideas

There is another opportunity to buy in IOSTBTCTechnical analysis:
. IOStoken/Bitcoin is in a range bound and the beginning of uptrend is expected.
. The price is below the 21-Day WEMA which acts as a dynamic resistance.
. The RSI is at 39.
Trading suggestion:
. Price is in the support zone (0.00000302 to 0.00000278), traders can set orders based on Daily-Trading-Opportunities and expect to reach short-term targets.
Beginning of entry zone (0.00000302)
Ending of entry zone (0.00000278)
Entry signal:
Signal to enter the market occurs when the price comes to "Buy zone" then forms one of the reversal patterns, whether "Bullish Engulfing" , "Hammer" or "Valley" in other words,
NO entry signal when the price comes to the zone BUT after any of the reversal patterns is formed in the zone.
To learn more about "Entry signal" and the special version of our "Price Action" strategy FOLLOW our lessons:
Take Profits:
TP1= @ 0.00000356
TP2= @ 0.00000374
TP3= @ 0.00000402
TP4= @ 0.00000421
TP5= @ 0.00000486
TP6= @ 0.00000592
TP7= @ 0.00000764
TP8= Free


There is a trading opportunity to buy in IOSTBTCTechnical analysis:
. IOStoken/BITCOIN is in a downtrend and the beginning of uptrend is expected.
. The price is below the 21-Day WEMA which acts as a dynamic resistance.
. The RSI is at 31.
. While the price downtrend in the Daily chart and the RSI (#1) is not broken, bearish wave in price would continue.
Trading suggestion:
. There is a possibility of temporary retracement to suggested support zone (0.00000315 to 0.00000294). if so, traders can set orders based on Price Action and expect to reach short-term targets.
Beginning of entry zone (0.00000315)
Ending of entry zone (0.00000294)
Entry signal:
Signal to enter the market occurs when the price comes to "Buy zone" then forms one of the reversal patterns, whether "Bullish Engulfing" , "Hammer" or "Valley" in other words,
NO entry signal when the price comes to the zone BUT after any of reversal patterns is formed in the zone.
To learn more about "Entry signal" and the special version of our "Price Action" strategy FOLLOW our lessons:
Take Profits:
TP1= @ 0.00000356
TP2= @ 0.00000374
TP3= @ 0.00000402
TP4= @ 0.00000421
TP5= @ 0.00000486
TP6= @ 0.00000592
TP7= @ 0.00000764
TP8= Free

IOST Rocky Mountain High - Trade Active - Targets IncludedIOST setup camp and remained there for quite some time at the base of the Rockies. Today it decided to pack up camp and head up the mountain! This isn't an easy hike and there will be some dangerous terrain and steep inclines, but it's well rested for the journey.
Trade is Active and Targets are in the Red.
Short-Term
T1: 354
T2: 401
T3: 475
T4: 518
How we Trade the Breakout:
IOST is looking great in the short term. We're looking for a 4 hour close on the 100, which we should get shortly. Once we close above the 100 we can enter with a tight stop below the 100 @ 325.
If you want to play it safe wait for the 4h close over 354 resistance. We'll keep an eye on the 4h chart to watch for the close. Once we've closed over 354 this becomes support. We set our stop losses 5% - 10% below this line. We decide how tight our stops should be based off of BTC's movement. I believe BTC has seen it's high for now and alts could start to bounce, however the bulls have shown their strength, so they could step it up again and try to break 8500 resistance. We always watch the king and follow his lead when trading alts. IOST is looking good in the short term if BTC can cool off and find some sideways movement.
Remember to take profits at targets and buy on the retrace. Don't FOMO! Wait for the ideal price to come to you. You can gauge good buying prices in shorter time frames utilizing our Stochastic indicator.
May your stack see blue skies and brighter days!
- CK
**This is not to be used as financial advice but rather for educational and analysis purposes**

IOST fell short in Supply in the Green AreaMassive pump in the green area, due to either a large buyer or a short in supply -- expecting a pullback to the 345-325 area and a continuation to the upside.
#TheColorchartist #TradeInColors #GBaz
Trade 5 IOST/BTC Challenge 1K to 100KWelcome back to my personal challenge. No trading advice.
0,128796 BTC @ 8265
entry #IOST at 378
stop loss at 364
34071 tokens
target 440
Dont FOMO buy on IOSTIOST is in pump and dump Cycle.
Please dont FOMO buy.Targets and price to buy on charts.Stay safe.

IOSTIOST/BTC AB = CD , Elliott Triangle Waves, falling wedge with testing after brokeout.
Targets
0.00000475
0.00000570
0.00000760

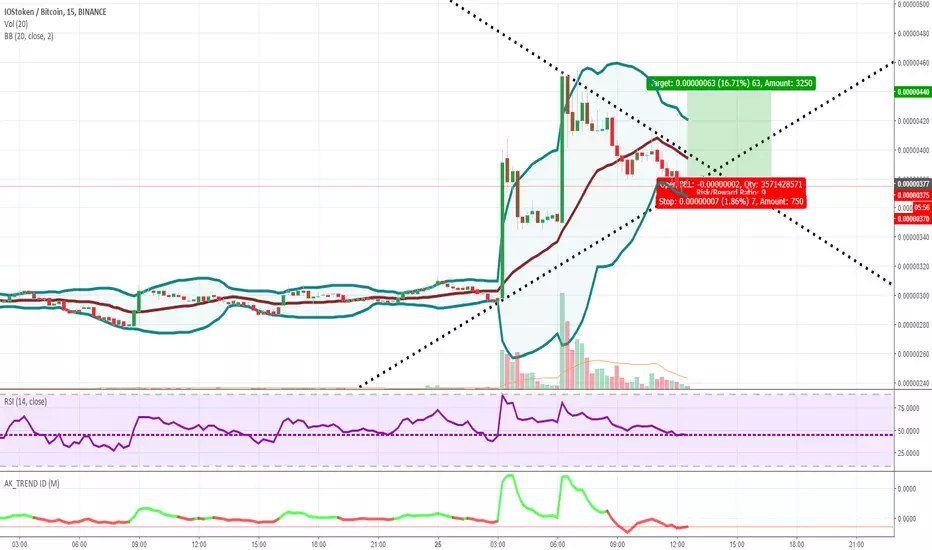
IOSTBTC: 200% Target, Resistance & SupportHello fellow traders,
We have broken the falling wedge downtrend resistance with massive volume. I suspect that is the end of wave 2, meaning that this is wave 3 and we should expect a 1.618% Fibonacci rise. Giving us a target in the 1200 sat region. This wave can be extended.
We have resistance at the 500,600 and 840 sat regions.
Ultimately we have support at 0.
Good luck and have fun!

IOSTBTC Short TermIOST BTC TF15, Hope im right about this one, SL when candle break under the support


200% Potential Iost? Iost is in this large falling wedge. It's only a matter of time until we see a break out.
There's two targets. The first target assumes a continuation of a bear market while the second target is cryptocurrency as whole rebounding into a bull market.
MACD showing bullish divergence
As of right now price was rejected by the 21 ema on the daily chart but my bias is to the upside once we see a breakout
*second target is a 1.618 extension of the first large run up


IOST Broke downtrend, lets see if its a false breakout.If its staying above the resistance we can start buying.


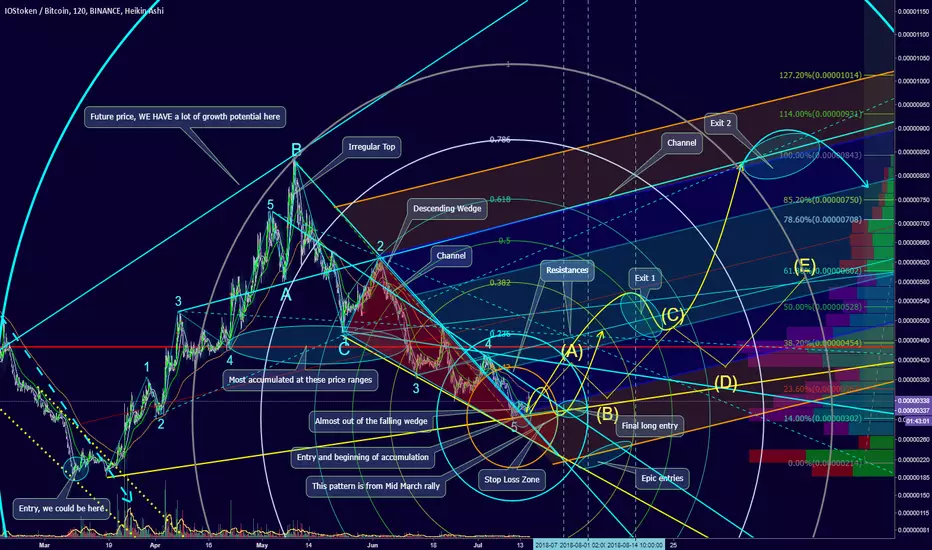
Are you ready for some March flashback? July 25-28 to the moon?Cleaner charts are provided below, with bigger picture include.
So lets quickly look at the march rally.
As you can see, last time we got out of the wedge, and began to rally hard.
But also notice where we are at right now, relative to early march.
This means we are just getting ready before the next major push begins.
We might not see any major spike until we break out of the last descending resistance line.
July 25 -28 is where we should begin our ascension to heavens.
So we definitely have ways how we can scale up in the price.
I also, see a possibility for A-E pattern. Hopefully it does not happen, but don;t freak out.
Just keep on accumulating at the bases, and you will do fine.
Also don;t forget the Stop Loss, anything below 290 should be considered a potential exits, and take a loss. Reenter if it returerns back to 300+
~Explore the chart for possible scenarios of price actions - use zoom and scroll for better view.~
/*This information is not a recommendation to buy or sell. It is to be used for educational purposes only.*/
If you want your coin to be analysed, JUST ask.
If you got a question, ASK away!
Thank you,
Ajion
IOST entry opportunityIOST looks like its setting up for a nice 3-5% trade.
I will be watching the 3 and 5 minute MAC D for a buy signal and will update if I pull the trigger.
I will be posting all of my trades on here from now on so follow me if you are intereseted in seeing more of my day trades.

MAPPING FOR POTENTIAL TRADES-IOST/BTC 30MRight now it is a wait and see on how the next couple of days are going to play out. Here are some pathways I think it may choose to go.
Signals:
Bullish- Your attention should be peaked once there is a close above the 68 EMA line (white line). This can be a potential higher risk/ higher reward buy if you are wanting to wring out every percentage point. A more conservative area to buy would be once there is a second close above the purple trend line marked “THIS PURPLE LINE!!”; however, I have a feeling that by the time there is a cross they will be sitting on top of one another. In the instance the 68 EMA crosses over top of the purple trend line then I would wait for a close above the 68 EMA before making a move.
Bearish- Attention should be peaked once there is a close below the blue line, marked “THIS BLUE LINE!!”, and wait to see if there is a pull back to test it as a new resistance. I would not make a move until there are two closes below this trend line to avoid any head fakes.
Big picture take:
Overall, I am definitely bearish; however, I can tell that the bears are losing some of their power over the bulls. This can be shown by comparing the highs from 03 JUN 2018, 20 JUN 2018 and 03 JUL 2018, but I think there is still some fight left in them. (picture below)
