IOSTBTC trade ideas


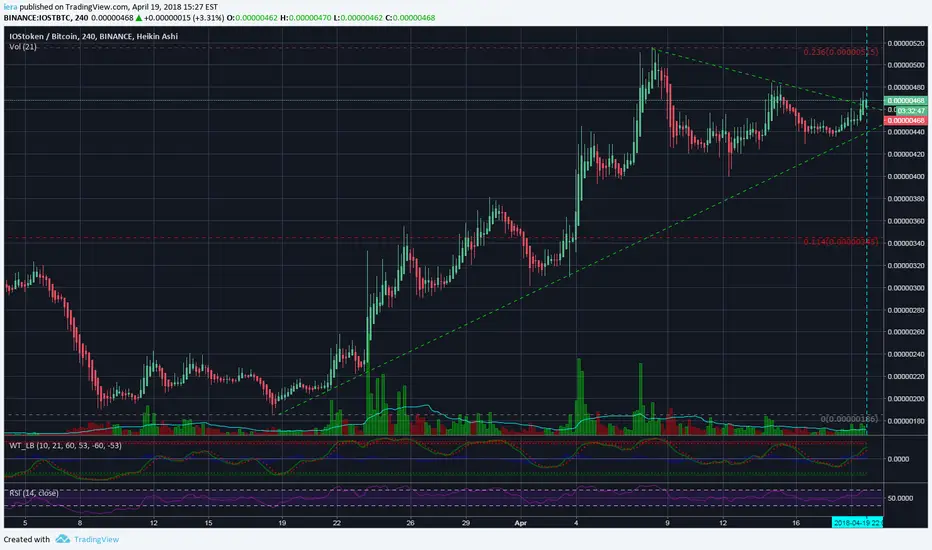
IOST 4HR UpdateSTOCH RSI is fully reset on the 4HR. RSI on 4HR is pointing upwards. Should see uptrend with bollinger bands labeled as potential targets.
THIS IS NOT FINANCIAL ADVICE!


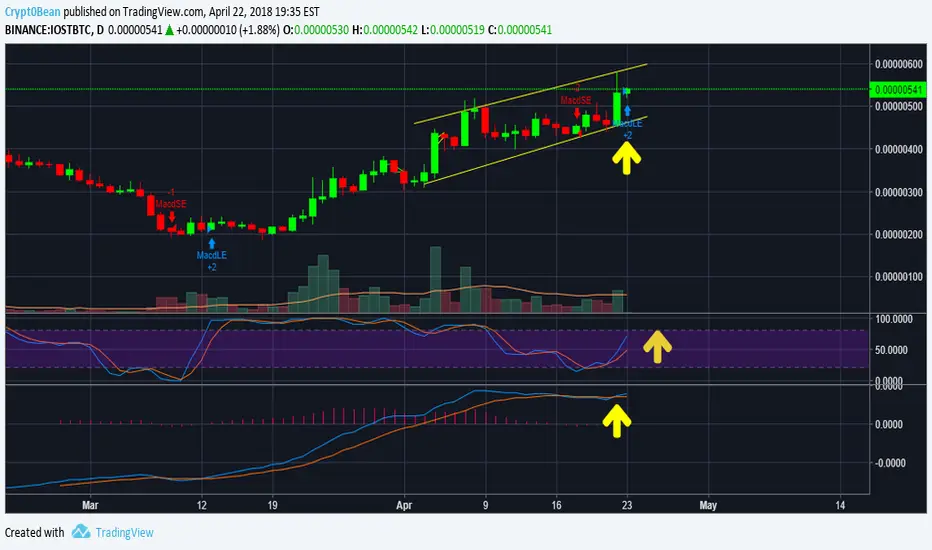
IOST very bullish for long term!Looking very nice for long term. I'd wait until we settle around 500-530.

$IOSTI love these kinds of charts, ones that follow patterns. For the last two pumps, the pump has happened on the 13th day after a series of sideways action. If the trend follows, slow growth from it's current position and in 13 days (11 is the shortest and 17 is the longest) there will be a sat gain. Overall, a 397 sat gain in 35 days, or a 67% profit if you rode it all the way. 532 seems like a great entry point considering the past month's history.

IOST steady growthIOST continuous to have a steady and healthy growth. there is a resistance around 566 sats, and a support at around 502 sats. We can also see that this cycle is currently in the middle of a small triangle. The trend lines touch in various points of the graph, and they give strong indicators that IOST would keep going up this week. However, if the volume of IOST increase, we can see it breaking the resistance and creating a new upward cycle. It is possible it would go down until 505 sats if it brakes the 530 sats resistance but it would recover to 566 sats shortly after

IOST Bullish Divergence on the Short-TermHere's a quick analysis on IOST for the short-term.
Watching the 15m charts, a hidden bullish divergence is forming between the Price and RSI. This divergence, along with the support line in white and the .786 retracement level, should be enough to break IOST out of this descending channel.
For price targets, I'll expect any of these retracement levels, but my sights are set on the .5 and the .382, seeing as how well IOST has respected Fib levels.
Good luck!

IOST dont FOMO buyWait for the 2 wave pullback than we will know targets..... Maybe a bit more up but doubt it


IOST - Huge profits IOST - Internet of Services is an incredible project that plans to achieve 100 000 TPS speed.
No doubts it can make x2 profits from that point in 3 weeks and even x5, x10 in LONG (till the New Year).
I hold IOST from 0,000003 BTC.
I see its bull run like Tron in November - January to 15 billion market cap easily from the current 420 million.
So just buy, relax and come back in the middle of May.
Neutral target to the 15th of May - 0,00001 BTC.


IOST-BTC ready to 3X from now !!Coin name : IOST-BTC.
Buy zone : 440 - 420 satoshi.
sell targets : 540 - 658 - 776 - 894 - 1012 - 1131 Satoshi .
Stop Loss : if two 4H candles closing under 420 Satoshi.
mid and long term trade.

IOSTBTC - Painting Promising PicturesIOST is one of my more promising Gen 3 Crypto picks, with an impressive team and recent good news including token lock up (medium.com), this should be a big gainer this year and beyond.
Cup And Handle, Fibonnaci - After finding a (double) bottom in the 190sat range, IOST has had a good couple of weeks, after forming a cup and hitting resistance at 520sat it has had a couple of red days forming the handle, the .786 fib is showing some support with historical support just below at 390sat, laddered buys around these areas are looking tasty.
RSI, Hidden Bullish Divergence - Price making a higher low, with RSI making a lower low gives hidden bullish divergence, right on the handle that is forming.


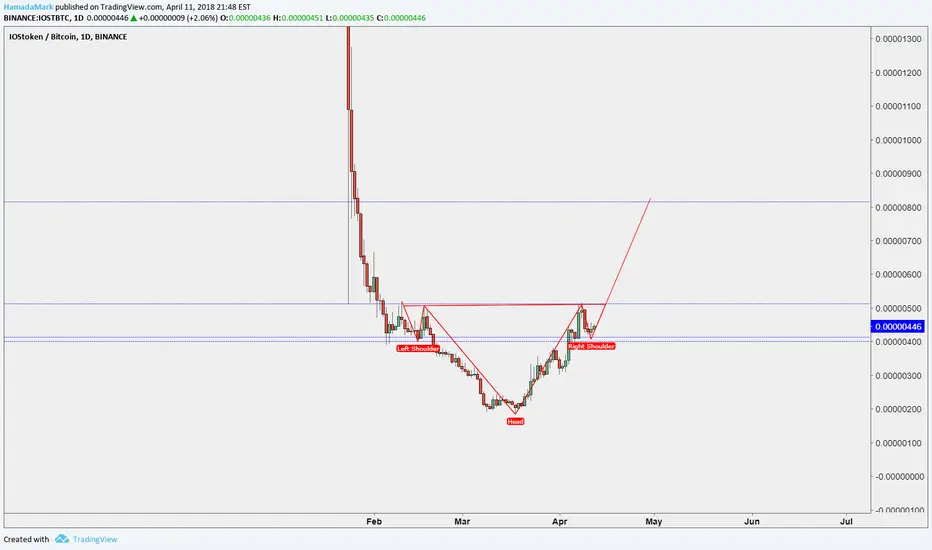
IOSTShow H&S
Targets
0.00000512
0.00000647
0.00000731
0.00000816
Stop_loss:0.00000367
Risk/Reward:18% / 82%
Invest:5%
we ask Allah reconcile and repay
Mentioned at TG Channel before
IOSToken I think IOSToken is ready for another move to the upside. We have been in this wedge (green dashed trendlines ) and are looking to break out as you read.
We'll probably turn the wedge into support. I have also rayed out the bottom trendline of the wedge so it can continue to support us on our way up.
I expect strong resistance between 700/719 and 884/900 and that is where the bottom trendline will come into play, but that's for later.
Target anywhere between 949 / 1049.
IOST TrendLet's see how this one turns out
Bounced off the trend line but I think it will retrace before going higher

IOST are we ready for next movewatch it next few hours
inter point 440
stop loss 385
take profit
502
565
645

