IOSTBTC trade ideas

IOST internet of service tokenInternet of services ... Sounds good
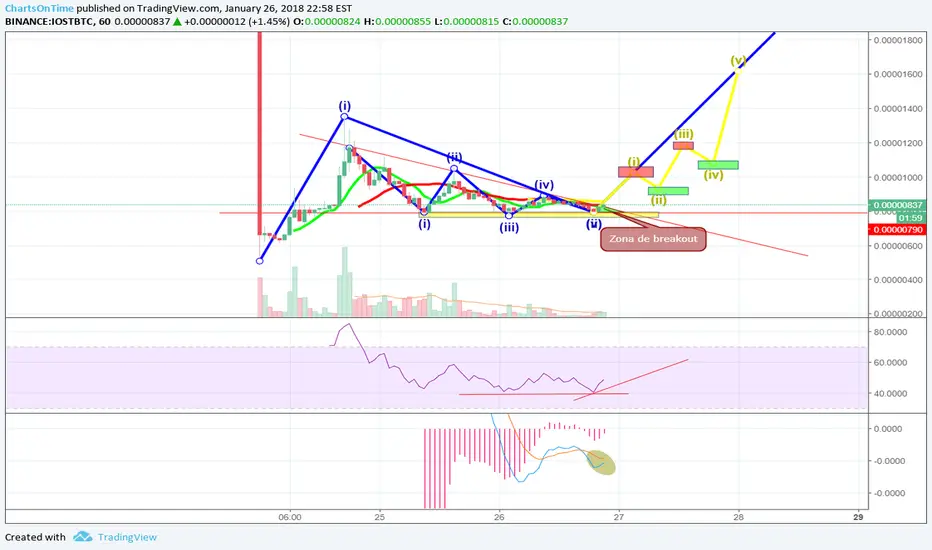
After adding in binance it was pushed a little push bit up and then came down. Now has consolidated but
this charts bitscreener.com (USD Pair) let me think that in the best case scenario it is ending a II Wave of Ellioth and it will initiate the III Wave. In the worst it will just follow a vawe V
So I'm in. Best buy is probably somewhere in the black case
RSI seems to support a trend reversal


IOST developing supportIOST is bouncing on a small support it developed when it first dropped, breaking to the downside of this pennant, this seems to be strong support that is developing so far. Watching for a bounce here.

[IOST/BTC] x2 Potential short term.This coin is ready to breakout just need more volume. Don't miss out this opportunity.
Trade at your own risk.

IOST MAYBE a Breakout comingRSI is low, it bounced off the support 3 times and it's riding the support right now. Buy in 760
Sell 780 Target 1 780 Target 2 800 Target 810

IOST is approaching to the end of his correction. BINANCE:IOSTBTC
IOST is looking good lately. Just saying.
Entry 800-850
Target 2000-2100
Disclaimer: This is not to push or stop anyone of making any financial decision but to offer an educated opinion.
Enjoy.
$iost Cup and handle might be formingLooking out carefully here for the completion of a cup and handle formation. Needs some volume. If not, sub 800 SAT is in the cards again short term.
Disclaimer: This is not financial advice to buy or sell. DO your own research.

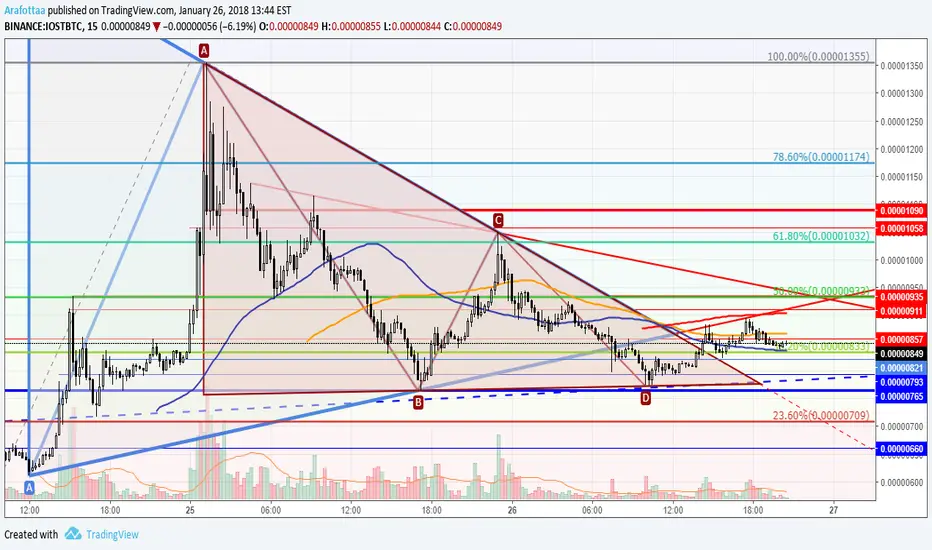
IOSTBTCThe price broke the channel on the old chart
, the big triangle and the uptrend, but its rebounded above the 0.00000765 level the bottom of the small triangle to broke the triangle and the " 38% Fibonacci " to test the uptrend " bottom line of the big triangle ", but its failed to close over it, So in my opinion the price will try to test " 38% Fibonacci " again to rebound from it to 0.00000911 level.
If the price close under 0.00000821 it will go to 0.00000793 to rebound from it, If the price keep over the " 0.00000857 ", it will go to 0.00000911 to test the uptrend and the downtrend.
If the price close over " 50% Fibonacci 0.00000933 ", it will go to 0.00001090 level.
IOST meets resistance againIf Btc can stay healthy we should continue on our path.
Pennant coming close to an end and a positive breakout will need a kick in volume.
GLTA
Stop loss 775* Need to make sure bottoms are constantly higher
New target 975
GLTA

IOST about to jump 80%This is what I'm using to trade right now (Post on Twitter @CryptoYoo):
1. I believe we just completed wave 1.
2. Price will drop to 900 sat mark.
3. Fib of previous waves and this wave lines up perfectly.
4. High volume.
5. This is a risky trade. My target 1800.

$IOSTBTC long idea$IOSTBTC long idea. Buy under 830 sats. Descending triangle and breakout expected.

IOST falling wedge after perfect elliot waveIOST jsut gotr released to Binance and made a perfect elliot wave after making some correction waves it seems to have filled in a nice falling wedge. Its sticking to the higher resistance so watch out for a high volume break upwards from levels shown above to confirm possible higher highs.

IOST Forming Symmetrical TriangleIOST is forming symmetrical triangle and possible breakout could be hours away. Price around 800sth was steady for a last few days, trading volume is one of the highest and this coin could really take off now


iost/btc quick gainsbuy: 800-810 sats
sell:
target 1-888
target 2-975
target 3-1036
stoploss: 741
tipbox:
17BUPYGRFqknHUSKTQAmNRrDKsMyH29rvZ - BCH
GTeHWtQaQAGeeEkW5gtgSPaWnMZmyQrUdR - BTG
XmXxWSgRqa4ZzzQUbWQnsAfxA1RGPScqZN - DASH
0xB62e34A9C3090Bb442a60C3f5d6Df72Db0341143 -ETH

Let's see now if this continuesLooks like the downtrend from earlier in the week is broken. Just needs volume

Elliot ABC retracementThis is a more in-depth update on the chart I posted yesterday, this time adding elliot waves to the mix. I know they are not standard, but the pattern seems obvious to me.
Atm there is resistance around the 0.786 fibs line, which should be broken if the full ABC retracement is complete. If we bounce off it instead it can signal another bullish run which would be a good entry especially since we're in OTE zone.
As always, do your own investments, don't just take my word for it, also any feedback is welcome :)

IOST short buy accurate area (IOStoken Pattern) - BinanceI've been watching charts for a few couple of months and this is the first pattern I made + published.
The last one I did from my head and applied on Binance I made a profit of 19% but this doesn't mean I'm right with this pattern.
Anyway, I decided to share and see if I can help someone new and is looking for a short-term pattern on IOST.
I'm not a specialist, I previously referred that I'm only watching charts for a couple of months.
I think it will reach almost 0.000007btc in 2 days maximum (28/01/1018).


IOSTBTCIost has a lot of momentum seems of start for new bullish breakout. May test ATH of 1300 sat in binance. Buy @ 900 and 800.

IOST is now going to fill into this wedge. IOST is now going to fill this wedge where there will be some nice scalping opportunities such as this morning. In at 815, target 900-950. BTC also at the bottom of the Pennant bouncing currently.
