IOST/USDT-1D-BINANCEThis is not a financial advice. Always do your own research and always put stoploss in your trade (SL) :) If you want more detailed info
how to study and read charts or just need help with some coin, just write to me here a comment, i will try to answer to everybody...
i can help you :) all for free, don't worry, BE HAPPY!
IOSTUSDT trade ideas

IOST/USDT TRADING PLANNING FOR SPOTIOST/USDT
With short-term, from the trend and pattern will going up to TP area
I hope you guys get something from my ideas
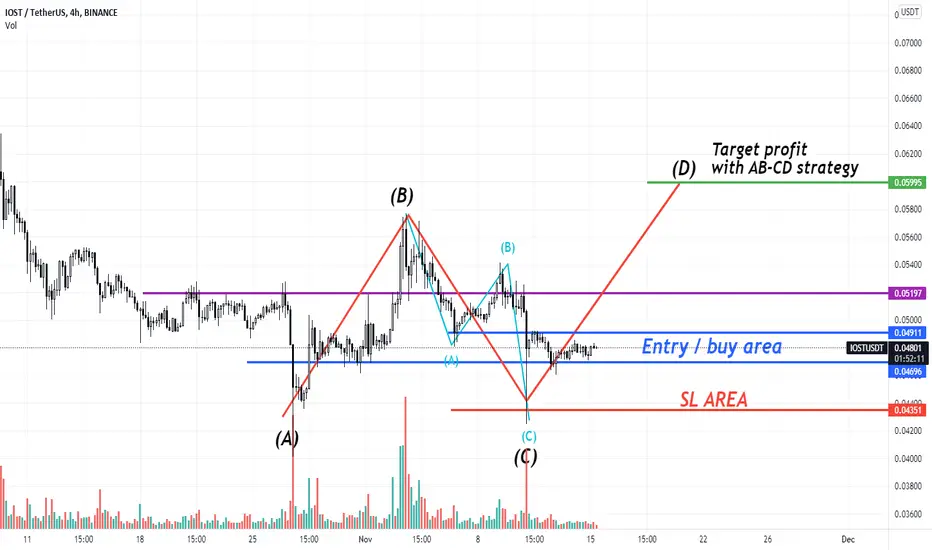
BLUE : ENTRY AREA
RED : SL AREA
GREEN : AREA FOR TAKING PROFIT
Make it simple and stupid, will give you convenience
#indonesia #tipsfortradingplanning

IOSTUSDTCup and handle breakout for iosdt. I will exit my position if we break under blue resistance line. Add to my position if we break the handle upwards. NFA


$IOST - Bullish Pinbar formed in Daily. Entering LONG#IOST has formed one of the most beautiful chart formations for me, consisting of a Daily pinbar in a strong support zone plus the MACD forming a twist in its MA’s, indicating a strong exchange in market direction.
ADX is super strong also, indicating the strong power of the current trend.
Placing Long positions from right here.
**WILL BE UPDATING**

CUP AND HANDLE IOSTUSDTHi Everyone,
Just spotted this Cup and Handle chart pattern on IOSTUSDT, daily candle above 200 MA, nice risk reward. Overall looks like a nice setup to go long here.
TP1:0.056
TP2:0.064
TP3:0.078
TP4:0.1
Let me know your thoughts on this pattern, how often do you use it, and rate it based on your experience on how reliable it is.
Cheers!!!

IOSTIOST (USDT)
buy if breaking the green line
and take 70% of your profit at TP1 (20%)
and take another 30% at TP2 (34%)
Good luck ........

IOST ANALYZEIOST IS IN TRIANGLE.
I think here is good point to entrance and we have good risk reward ratio =3.5
i never use indicators to analyse in cryptocurrency market although 2 indicators confirm long position.

IOSTUSDTPERP LongI saw the Butterfly harmonic pattern on the IOSTUSDTPerp in 1H TF. The price is perfectly re-testing the current support. Once rejection on the support is confirmed it is safe to enter the trade. If you want to enter the trade, please don't use more than 1% of your capital and manage your risk wisely.

Big triangleThe price is compressed at a key level (0.05).
If it breaks, there would be a good buying opportunity taking advantage of the momentum.

iost in kucoinHello
You can expect the pump to break up the arrow after breaking the black resistance line

Formed a perfect cup and handle
I do not think it will go wrong from here , feeling super bullish and patience is the key .
Happy trading :) !

IOST/USDTIost/usdt will go same chart like RSR we wait for these TP,so just hodl and invest wait for these targets....

IOSTUSDTHello to all dear traders, I hope you always hunt for big profits.
DISCLAIMER:
This is not financial advice! This is an opinion-based show. I am not a financial adviser. Please only invest what you can afford to lose, and we encourage you to do your own research before investing.
everyone should buy and sell according to their own strategy.
Everything you need to know is outlined in the chart and keep in mind that we are moving forward with probabilities and the analysis may be wrong so take capital management seriously.

iostbuy now 20x goooooooooooood buybubyubybuybubyubyubyubyubybubuububyubyubuybubuubbyybyybyybybybybyyyyyyybybyybybybuububuyybubybyy

IOSTUSDTPERP LongThe price is re-testing the current support level. I am hoping to see rejection at the support and will enter the trade once it's confirmed. This is not financial advice, if you want to enter the trade please manage your risk and just use a maximum of 1% of your capital to enter the trade.

#IOSTUSDT#IOSTUSDT
Can pullback to the trend line and rise to targets : 0.5 , 0.6 , 0.7
It has good support line.

IOST/USDT 4HOUR UPDATEWelcome to this quick
IOST/usdt analysis.
I have tried my best to bring the best possible outcome me in this chart.
Reason of trade :-iost/usdt is triangle pattern conform and triangle retest and buy the dip and long term hold
Entry:- cmp And buy the dip in green zone
Traget:- 150% to 200%
Stoploss:- $0.04448
Remember:-This is not a piece of financial advice. All investment made by me is under my own risk and I am held responsible for my own profit and losses. So, do your own research before investing in this trade.
Happy trading.
Sorry for my English it is not my native languages.
Do hit the like button if you like it and share your charts in the comments section.
Thank you...

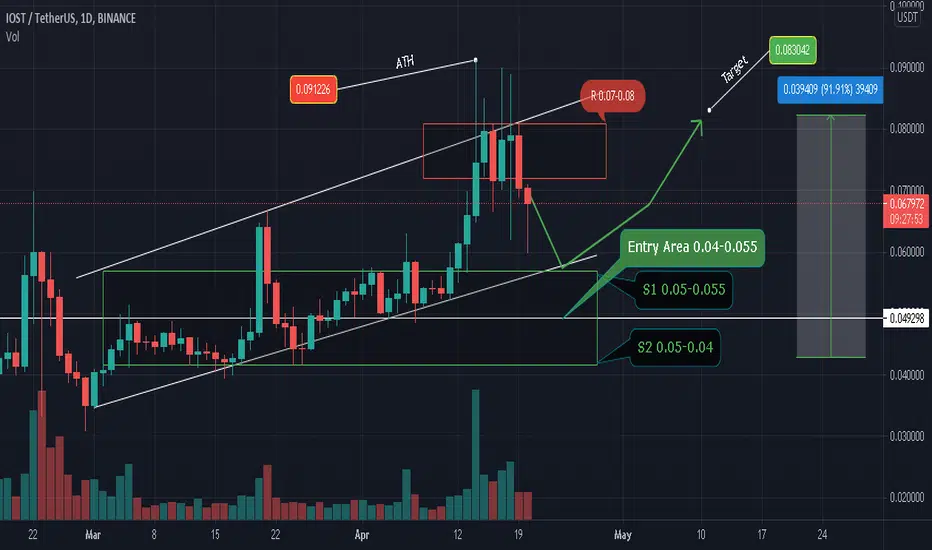
IOSTUSDT Drop before Retesting ATHBINANCE:IOSTUSDT possible drop to Suupport levels 0.04-0.055 Before it can restest the all time high.
The trend is still Heading UP, no marks of breaking the trend have shown until this moment. No technical signs indicating any former disrespect from the price towards the trend.
The trade infos>>>>>
Entry point: 0.04-0.055 .... dividing Entry on different prices is preferable to make a lower average entry price and maximize profits.
If the price doesn't fall to 0.055 at least on 28 April Consider the trade canceled and move on.
The only target is Near the last ATH: T = 0.083
Profit from 0.04 Entry to target = 95%
Expected average time to Reach target: 1 Month Average.
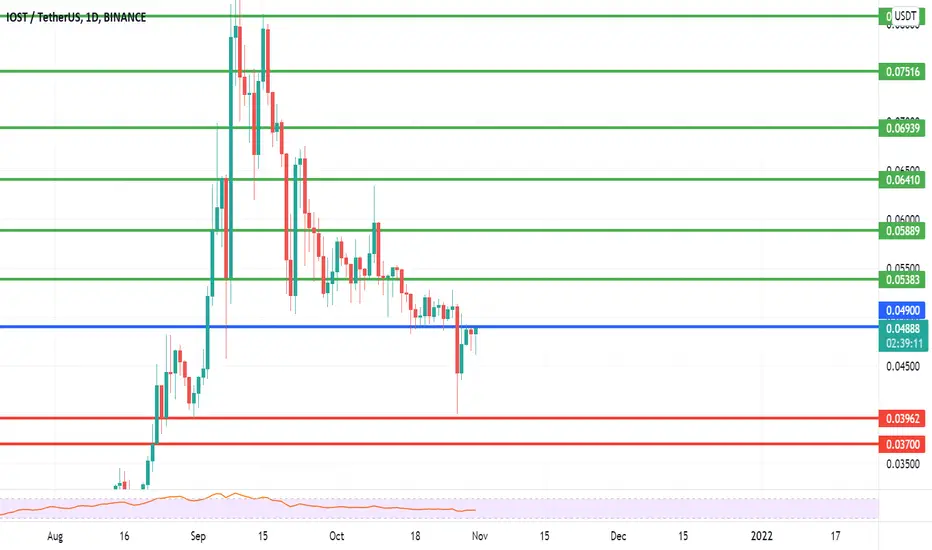
#IOST NEW BUY IDEABuy
at the market price
targets
in green
stop loss
daily close below
0.037
trade safe
check the related ideas , you gonna like it :-d
IOST: Very RespectfulSo our friend IOST has come and decided to play some games. Price targets are at respected FIB levels. What do we think everyone? Real or BS?

IOST / USDT18% profit potential here if IOST breaks a couple levels. just got back above the 200 SMA on the 4 hour
