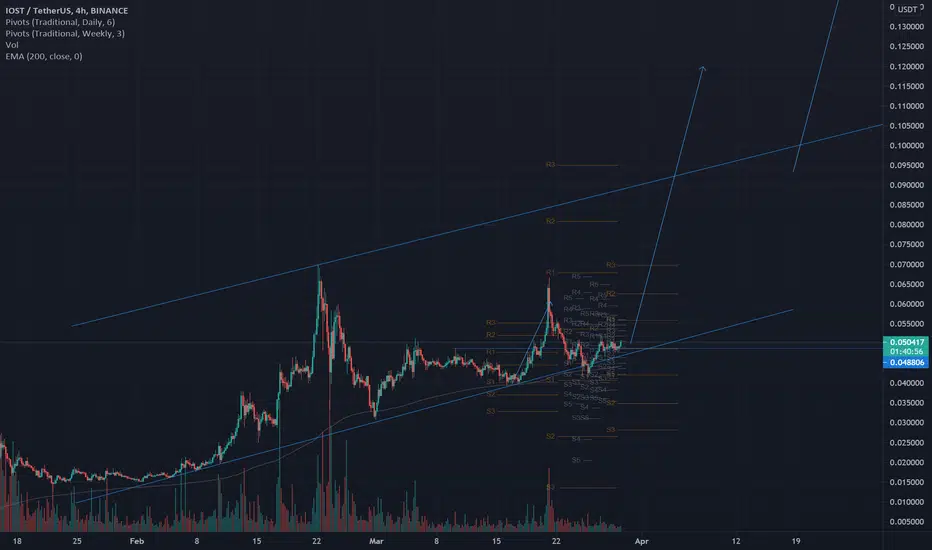
IOSTUSDT is testing the daily resistance 🦐The prices created a double top and had a retracement. Now the price is testing daily resistance. IF the price will have a breakout and flip the current resistance into new support, According to Plancton's strategy (check our Academy), we can set a nice order
–––––
Follow the Shrimp 🦐
Keep in mind.
🟣 Purple structure -> Monthly structure.
🔴 Red structure -> Weekly structure.
🔵 Blue structure -> Daily structure.
🟡 Yellow structure -> 4h structure.
⚫️ Black structure -> <4h structure.
Here is the Plancton0618 technical analysis, please comment below if you have any question.
The ENTRY in the market will be taken only if the condition of the Plancton0618 strategy will trigger.
IOSTUSDT trade ideas

🆓IOST/USDT Analysis (29/3) #IOST $IOSTIOST is trying to conquer the 0.05$ zone, if successful, IOST will head to the 0.06$ zone. But if it is rejected again at this 0.05$ zone, it will move down to 0.035$ zone.
📅NEWS
👉Aug 1 : Monthly Airdrop Ends
📈BUY
-Buy: 0.035-0.035$. SL B
📉SELL
-Sell: 0.049-0.051$ if B. SL A
-Sell: 0.057-0.06$. SL A
♻️BACK-UP
-Sell: 0.035-0.037$ if B. SL A
-Buy: 0.029-0.031$. SL B
-Buy: 0.049-0.051$ if A. SL B
❓Details
Condition A : "If 1D candle closes ABOVE this zone"
Condition B : "If 1D candle closes BELOW this zone"


💡IOST: BUY Trade🚀🚀🚀🚀🚀🚀 #ALTSEASON2021📈#IOSTUSDT
➡️Entry: 0.046900$
🎯Target 1: 0.055300$
🎯Target 2: 0.064500$
🎯Target 3: OPEN

IOST HİT & RUNIf it breaks 0.506, 0.540 comes.
Breakdown should be expected..
Turkish explanation:
Eğer 0.506 kırarsa, 0.540 gelir.
Kırılım beklenmeli..


🔥 IOST Bullish TriangleJust most other cryptos, IOST is seeing some strong price action as of late. Currently, the price is still faitly close to the bottom support, so that gives IOST quite some upside.
If bullish pressure continues to build and BTC stays relatively calm, we can expect the triangle to complete in a matter of days.
Buy: 0.0485
Target: 0.065 - 0.075
Stop-loss: 0.041
Happy trading!


IOST ANOTHER BULLISH IMPULSE AHEAD?Hello Traders, This is my Analysis on this Pair. Price is still Bullish on the Monthly Timeframe, however we have a retracement on
the weekly and daily Timeframe. Price is currently respecting our 0.786 FIB. I will be monitoring Price Action with my Community for a Trading Opportunity in the Coming days if price respects this Level.

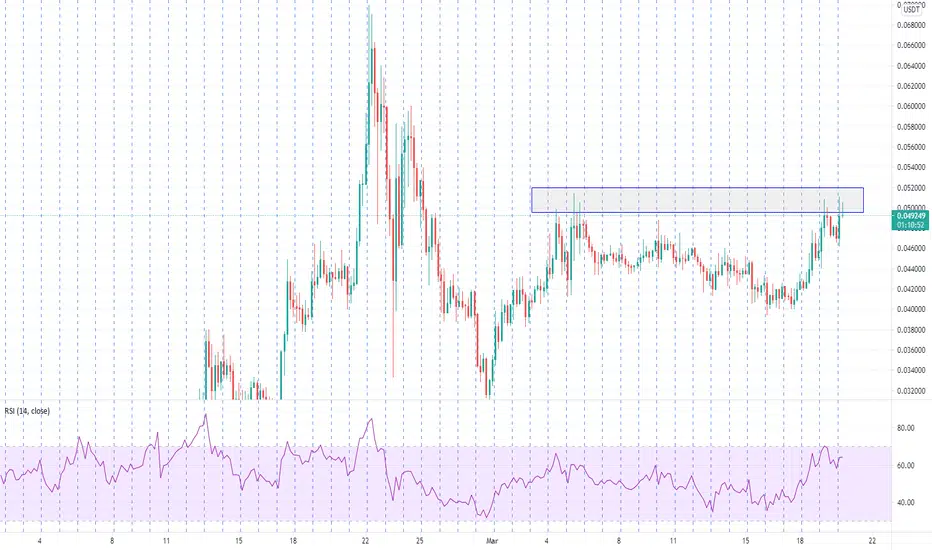
$IOST Breakout & RetestIOST currently retesting its previous highs and breaking out of its short term downtrend.
Lots of hype around this crypto so the TA and the Fundamentals are aligning on this one.

IOST Another Pump Will ComingAs we know, today is altcoin day
After breaking falling wedge pattern & FIB 50%, IOST is now facing strong resistance at 0.0522 Blue Line
If price cannot break this resistance, price will go down to support at 0.0468 Green Line or facing again 38.2% FIB
Yellow area is best area to buy
Our taget at 100% & 161.8% FIB


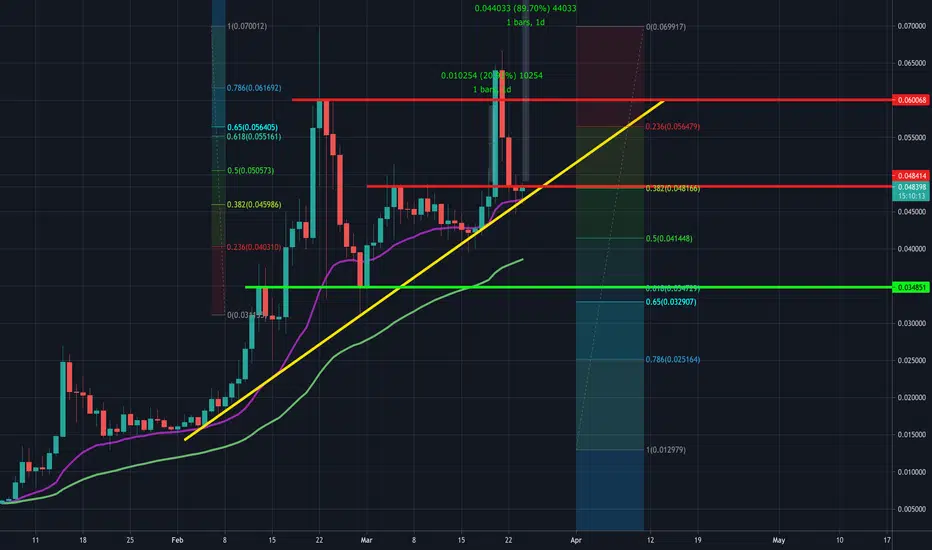
IOSTUSDTWEEKLY
Price currently showing strong weekly bullish momentum since January 11th, after forming a high from the A-B impulse wave, before retracing to the 61.8% fibonacci level.
DAILY
After the weekly retracement to the 61.8% fibonacci levrel price began consolidating and formed a bullish flag pattern which began on the 5th of March until the 18th. Price finally broke resistance of the upper trend line and continue higher above the previous weekly high.
4HR
I have highlights onthe 4HR chart confluence between the weekly retracement and the daily retracement lining up with the 50% fibonacci retracement.
ENTRY
0.050000USDT
S.L
0.039255USDT
T.P
0.069662USDT
R:R
1:1.83


IOSTUSDTIOST look ready to move
SL if close under 0.4
TP : 0.05 - 0.055 - 0.06 - 0.065 - 0.07 ---- 0.075 ++
You can check twitter IOST for Fundamental News
DWYOR and Good Luck

IOST MONTHLY WEEKLY AND DAILY ANALYSISDear Traders, this is my Video Analysis on this Pair, Kindly Drop your thoughts on the Probability of a bullish or bearish move in the coming days.
