Breakout was successful, it should keep goingI've entered IOST just before it broke out this big fallingh wedge but I forgot to post the signal. Despite me being late, as you can see it has a lot of way to go. Moreover IOST is working with Chinese government as the platform for digital Yuan. When TA and FA are both positive this should be a huge blast. I think there's still time to buy and exit in profit.
IOSTUSDT trade ideas
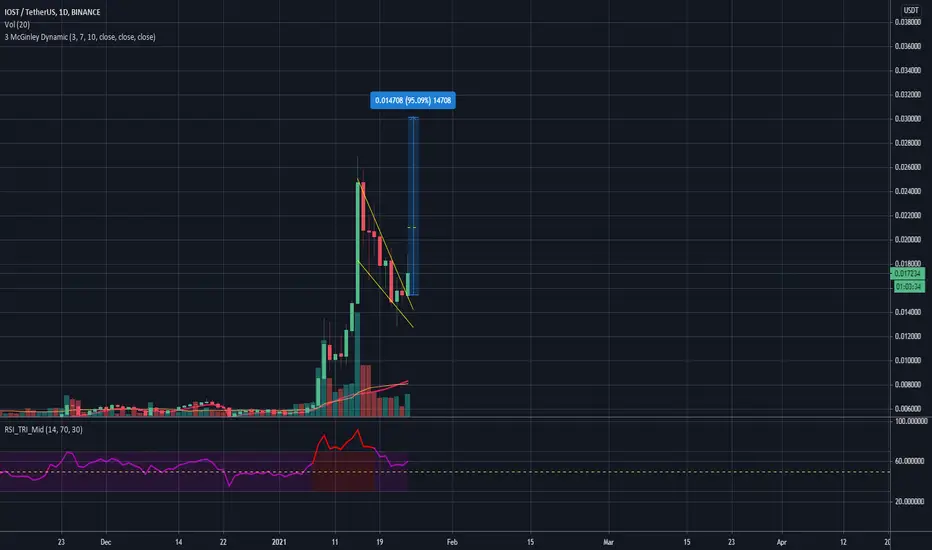

Inverse head and shoulders reversal pattern - IOSTUSDT review 📚Good day everyone.
Today, I'll be discussing on the inverse head and shoulders reversal pattern.
1. DEFINITION
What is Inverse Head And Shoulders?
An inverse head and shoulders, also called a "head and shoulders bottom", is similar to the standard head and shoulders pattern, but inverted: with the head and shoulders top used to predict reversals in downtrends. This pattern is identified when the price action of a security meets the following characteristics: the price falls to a trough and then rises; the price falls below the former trough and then rises again; finally, the price falls again but not as far as the second trough. Once the final trough is made, the price heads upward, toward the resistance found near the top of the previous troughs.
2. ENTRY
The entry (buy order) of an inverse head and shoulders pattern should be placed above the neckline resistance (breakout).
3. TARGET (TAKE PROFIT)
The target level of your inverse head and shoulders pattern should be the distance of the head to the neckline resistance. When this pattern is formed in a channel support or rectangular pattern support, your target levels should be the channels resistance and rectangular pattern resistance respectively.
4. SETUP INVALIDATION AND STOP LOSS
The setup invalidation of this setup is a breakdown below the shoulders support level.
The stop loss can be less than or equal to the setup invalidation.
TRADE EXAMPLE
I'll be using my analysis on IOSTUSDT as a trade example on the inverse head and shoulders reversal pattern.
My entry (buy order) ⬆️ - breakout above the neckline resistance.
My target 🎯 - distance (head - neckline resistance).
Setup invalidation ❌ - breakdown below the shoulders support level.
Stop loss 🔴 - setup invalidation / 2.
The trade played out as expected, hitting my take profit and it's still pumping.

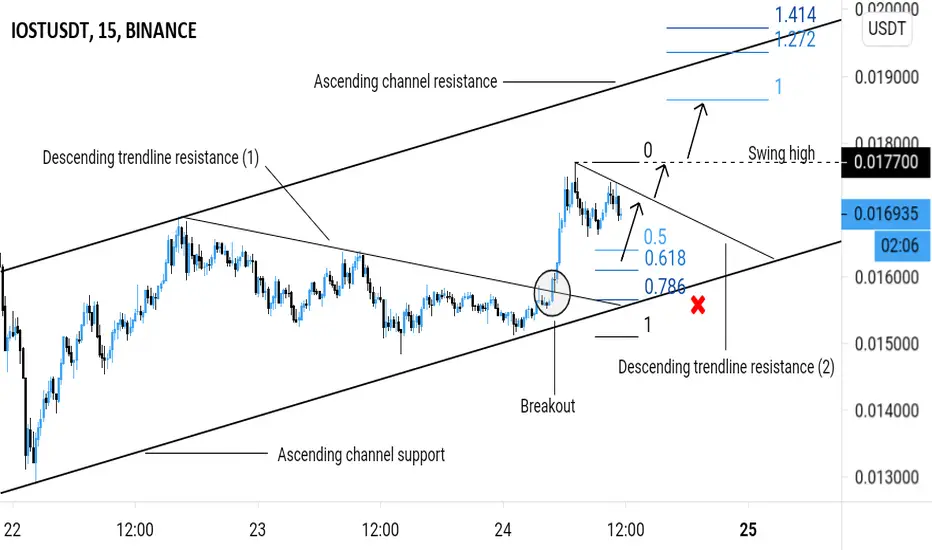
IOSTUSDT (IOST) - UPTREND CONTINUATION ANALYSIS 🔎
- IOSTUSDT bounced off the ascending channel support and brokeout above the descending trendline resistance (1).
- Price is heading to the ascending channel resistance.
- Price is undergoing a minor retracement to the key fibonacci retracement levels.
- We could see an uptrend continuation from those key levels.
- The minor retracement is resisted by the descending trendline resistance (2).
BUY ENTRY ⬆️
- Aggressive (risky) : fibonacci retracement levels.
- Conservative : breakout above the descending trendline resistance (2).
TARGETS 🎯
- Swing high
- Fibonacci extension levels
SETUP INVALIDATION ❌
- Breakdown below the ascending channel support.

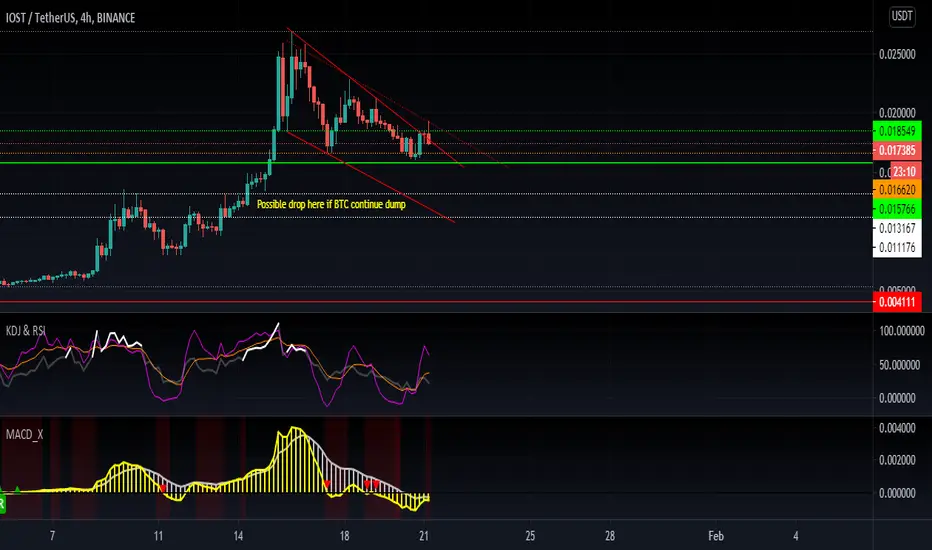


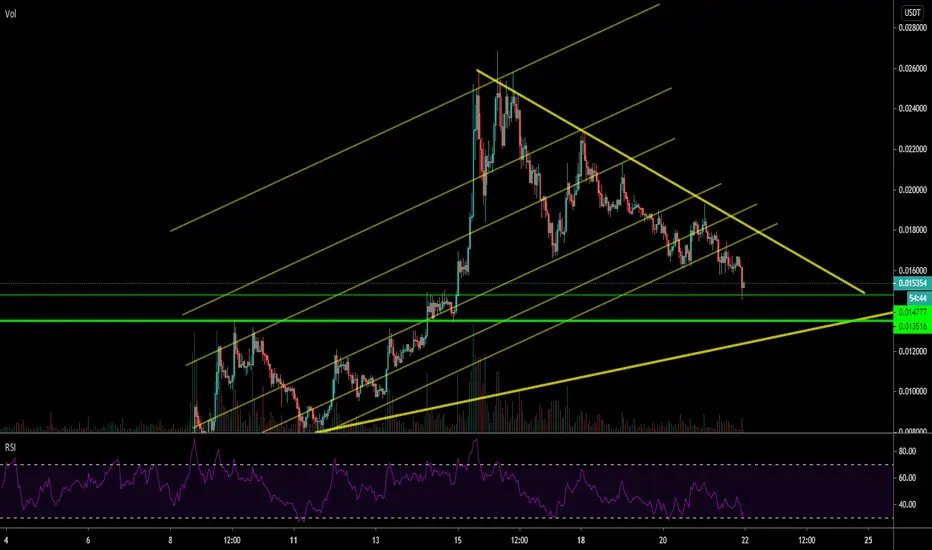
✳️IOST/USDT Analysis (24/1) #IOST $IOSTIOST just broke out of the Falling Wedge pattern after testing $0.015 zone, so we can expect another strong rally of IOST.
If IOST conquers $0.02 zone, it will return to test its recent peak at $0.026 and it is highly likely that it will continue to rise to $0.032 zone over the next few days.
📅NEWS
👉Jan 21 : Dev Updates
👉Jan 22 : IOST/HUSD Integration
👉Aug 1 : Month Airdrop Ends
📈BUY
-Buy: 0.014-0.015$. SL B
-Buy: 0.019-0.020$ if A. SL B
📉SELL
-Sell: 0.019-0.020$. SL A
-Sell: 0.026-0.027$. SL A
-Sell: 0.031-0.032$.SL A
♻️BACK-UP
-Sell: 0.014-0.015$ if B. SL A
-Buy: 0.010-0.011$. SL B
❓Details
Condition A : "If 1D candle closes ABOVE this zone"
Condition B : "If 1D candle closes BELOW this zone"


Retracement? IOST/USDT is this an opportunity to buy?Emotion does effect our trading decisions. Remember when price move up just a few days or week ago. Did you feel like missing the boat. Well now IOST/USDT is nearing major Fibo retracement zone. Will you buy here or wait for further downwards price action? #rememberfomo


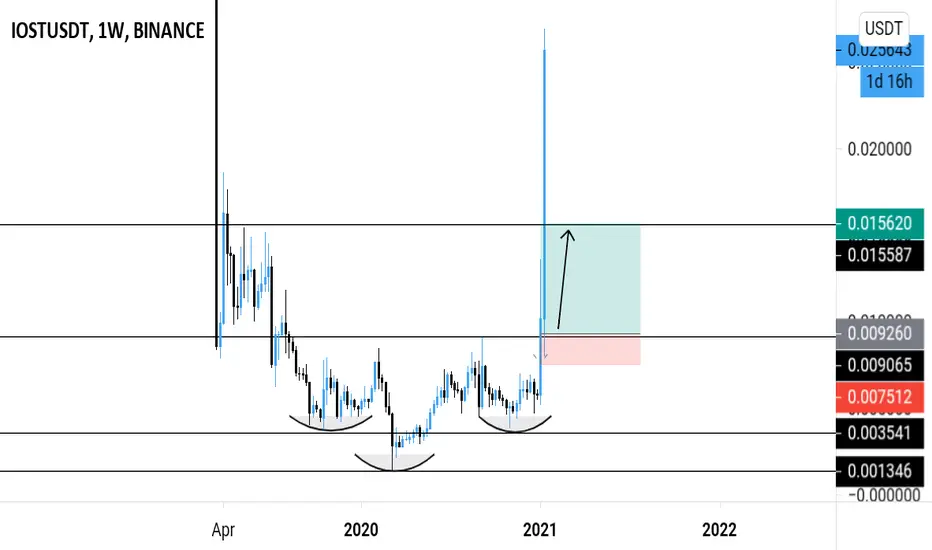
IOST CUP & HANDLE its getting there. IOST FORMING A CUP AND HANDLE
i dunno why but i never go for the full 100% lets see where it goes..
i try to learn where to find the sweetspot on these CUP & HANDLE Patterns and ofcourse there is google but i try to make it better to enter the market on this one.
so would like to see some suggestions from people who are more experienced in this.

