IOST USDT What we see now :
1- the price at 0,023 $
2- the resistance level at 0,015$ “ we have to wait for daily confirmation “ to turn the resistance to support level
3- there is three positive buy signals yet are active
4- the price cross ATH
What we do now :
- wait for daily confirmation closing and turning the resistance to support and with positive buy signals then it will be a good deal at this level
( YOU MUST WAIT FOR DAILY CONFIRMATION )
TRADE WITH YOUR OWN RESPONSIBILITY
IOSTUSDT trade ideas

IOST 1D How long will it grow?The long unremarkable coin IOST remind of itself very loudly :)
On 8 January, 2021, IOST co-founder Jimmy Zhong tweeted: "On 16.01.2021, expect a 'big' announcement." This was done just in the consolidation, when it was necessary to break the white uptrend. And the process went on, and how it went), such an intriguing tweet brought investors x4 in a week.
But there is a very good phrase:
"Buy on the rumor, sell on the news"
Now the price of IOSTUSDT has come to the first level of $0.024 , where a correction can begin.
But there is still a day before the publication of this "mysterious announcement", and accordingly, there is still time to fly to a much stronger level of $0.35.
We do not see above yet.
If you are a lucky one who has a long IOSTUSD, pull the stop up following the price movement so as not to give your profit to the market!
_______________________________
Since 2016 , we have been analyzing and trading the cryptocurrency market.
We transform our knowledge, trading moods and experience into ideas. Each "like under the idea" boosts the level of our happiness by 0.05% . If we help you to be calmer and richer - help us to be happier :)


IOSTUSDT - EW analysis - IOSTUSDT - It is in about to finish the 5th wave of 3rd wave up. There are expecting correction time, only after some confirmatory down move. Because there is always extension possible in high leveraged market like crypto. Let's see how it moves next ...
Give thumbs up if you really like the trade idea.

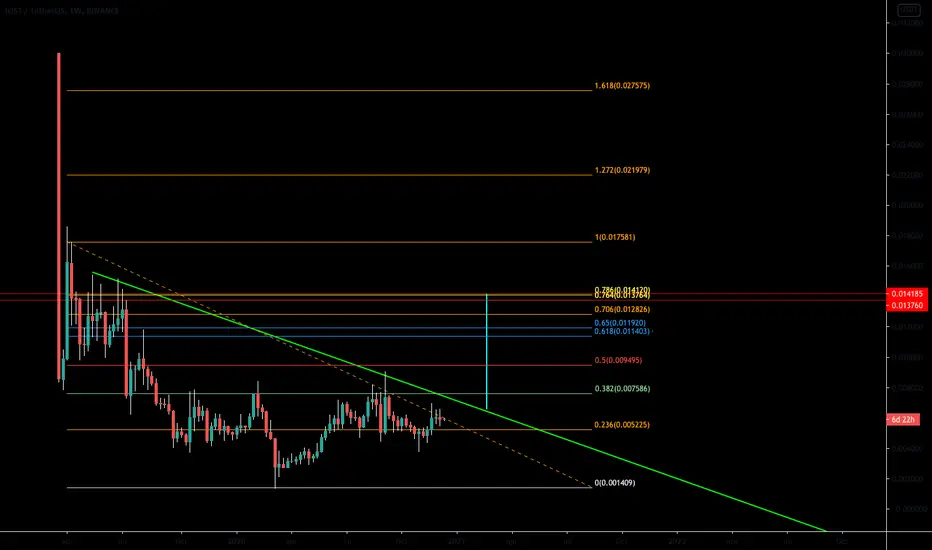
IOSTUSDT 4H Chart.Pennant or not?A symmetrical triangle must be at least 3 weeks to qualify as such,whereas a Pennnat a few days up to 3 weeks.To have a penanant we need also a steep long price move.Here we do not have this steep long price move before the pennant.Nevertherless,I will give it a try.So I measured the pole from the resistance at the bottom, where I think the small pole started to the highest point in the pennant.We had a breakout already.We have, according to the statistics from Bulkowski,47% chance to have a throwback.We are approaching the Monthly and Weekly resistances.I guess the resistances will play their role and we should have a throwback to the pennant trendline and then an upward move through the resistances.The average rise after a breakout is 25%.This brings us to 0,011288.And according to my pole measurement to 0,019383.Let's see.

IOST LONGIost making a beautiful ascending triangle, forming nice higher highs and higher lows. With a big announcement soon, strong potential to do really well.


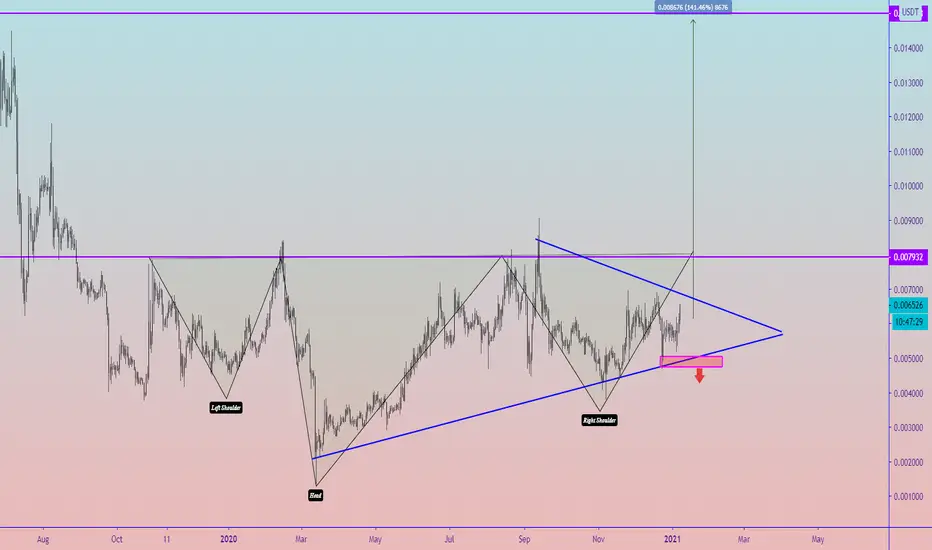
IOST IOSTUSDT - Head and Shoulders + 800% gains- We can cleary see a head and shoulders pattern on the weekly candles, which give us great buying opportunity
- The price is above main trendline, and above head and shoulders neckline (breaking out)
- Target is around 0,1 USDT
If you want more of these ideas, hit the like button and follow me, so you don't miss any update!
Also, check my signature down below ↓


#IOSTUSDT (Watchlist)#IOSTUSDT showing Clear H&s on 3D&W TF by Compleat this pattern next targets for IOST will be 0.0075/0.010/0.017.
What we mean by Add this coin to the watchlist ?! 👀
This means the coin we mentioned shows a reversal pattern or moving near a historical bottom, around or above good support, increase in trading volume , accumulation stage, breakout pattern, etc, so, we tell you to keep your eyes on this coin and add to your watchlist.
In the end, This is not financial advice, The purpose of these Charts to give you an idea about coin movement (not buy or sell signal) so before following any idea be sure to do your own research, and follow your risk management. Also, the information we mentioned here is a personal effort that is subject to success or failure and we welcome constructive criticism.
Hitting "like button" and leaving your "comments" below our ideas is great and supports us provide more ideas❤️
Good luck to all.
we ask Allah reconcile and repay🙏
✳️IOST/USDT (1/12) View + Trading Plan #IOST $IOSTIOST is heading towards and breaking down of the 0.008$ zone. This is the resistance zone that has continuously rejected IOST for 1 year now. Currently IOST has formed a Head & Shoulders pattern and this is the best chance for IOST to break through it to move to higher resistance zones at 0.013$ and 0.015$ by early 2021.
📈BUY- LONG
-Buy: 0.006-0.0063$.SL if B
-Buy: 0.005-0.0053$.SL if B
📉SELL-SHORT
-Sell: 0.008-0.0085$.SL if A
-Sell: 0.0125-0.013$.SL if A
-Sell: 0.015-0.0155$.SL if A
♻️BACK-UP
-Sell: 0.005-0.0053$ if B.SL if A
-Buy: 0.003-0.0033$.SL if B
❓Details
Condition A : "If 3D candle closes ABOVE this zone"
Condition B : "If 3D candle closes BELOW this zone"


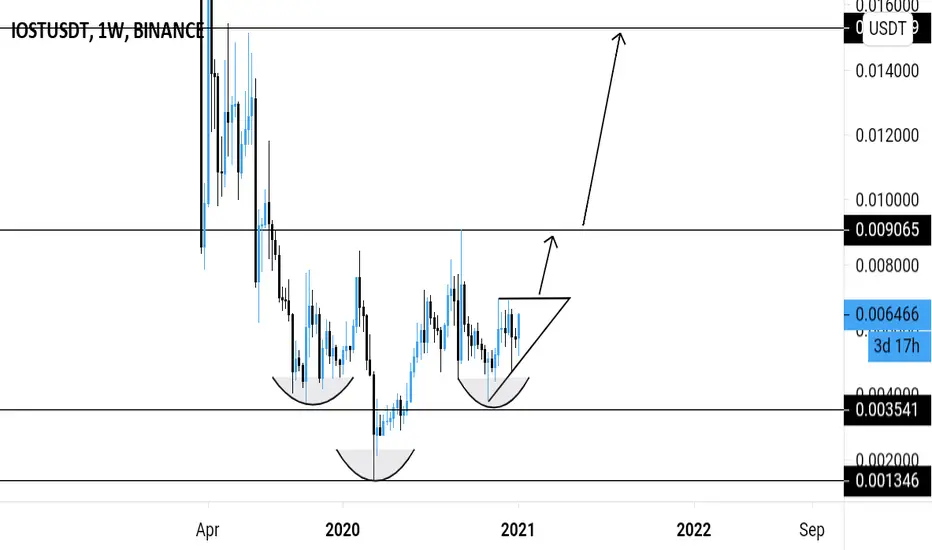
IOSTUSDT - Inverse head and shoulders pattern 🔼IOSTUSDT is printing the inverse head and shoulders trend reversal pattern on the weekly timeframe.
This is a double trade setup.
First trade setup
The inverse right shoulder is building up in an ascending triangle pattern.
Possible breakout above the triangle resistance to the inverse head and shoulders neckline resistance ⬆️.
Buy entry ⬆️ - breakout above the ascending triangle resistance.
Target 🎯 - Inverse head and shoulders neckline resistance.
Setup invalidation ❌ - breakdown below the ascending triangle inclined support.
Second trade Setup
If the first trade Setup remains valid.
The inverse head and shoulders reversal pattern will be completed.
So we're looking for a possible breakout above the inverse head and shoulders neckline resistance ⬆️.
Buy entry ⬆️ - breakout above the inverse head and shoulders neckline resistance.
Target 🎯 - resistance levels.

IOST BUY THOSE TOKENS#IOST ranked as 1st crypto for technology innovation.
100 million market cap.
10x easy in 2021.
100x with added FOMo.


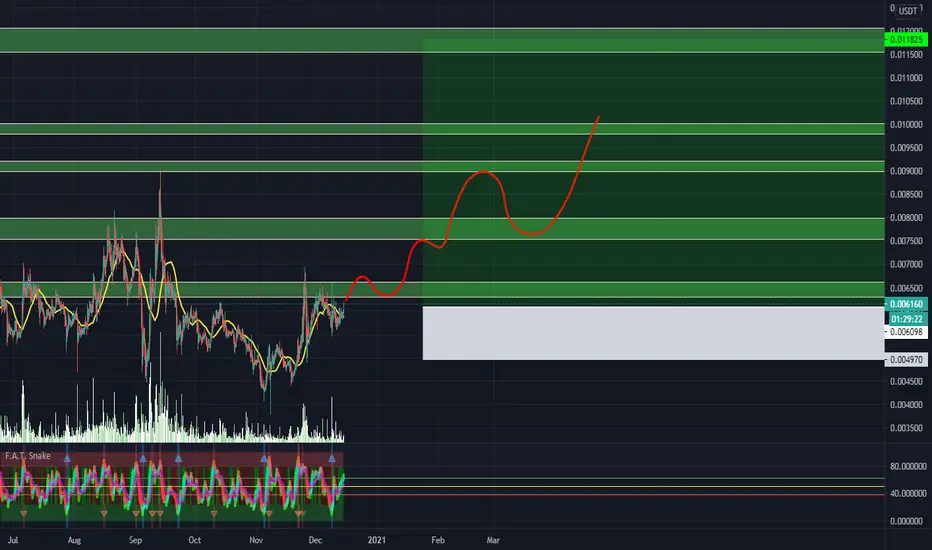
IOSTUSDT Testing 4h resistance 🦐IOSTUSDT Testing 4h resistance, after had a breakout from daily resistance and flip into new support. IF the price will have a breakout from 4h resistance and flip into new 4h support, According to Plancton's strategy (check our Academy), we can set a nice order
–––––
Follow the Shrimp 🦐
Keep in mind.
🟣 Purple structure -> Monthly structure.
🔴 Red structure -> Weekly structure.
🔵 Blue structure -> Daily structure.
🟡 Yellow structure -> 4h structure.
⚫️ Black structure -> <4h structure.
Here is the Plancton0618 technical analysis, please comment below if you have any question.
The ENTRY in the market will be taken only if the condition of the Plancton0618 strategy will trigger.


IOST/USDTLong way to go but has some major upgrades Dec through to March/April 2021. One to keep an eye out for.
coinscalendar.com
IOSTUSDT - Weekly analysis IOSTUSDT is printing the inverse head and shoulders trend reversal pattern on the weekly timeframe.
Buy entry ⬆️ - breakout above the inverse head and shoulders neckline resistance.
Target 🎯 - Resistance level.
Setup invalidation ❌ - breakdown below the inverse shoulder support.
