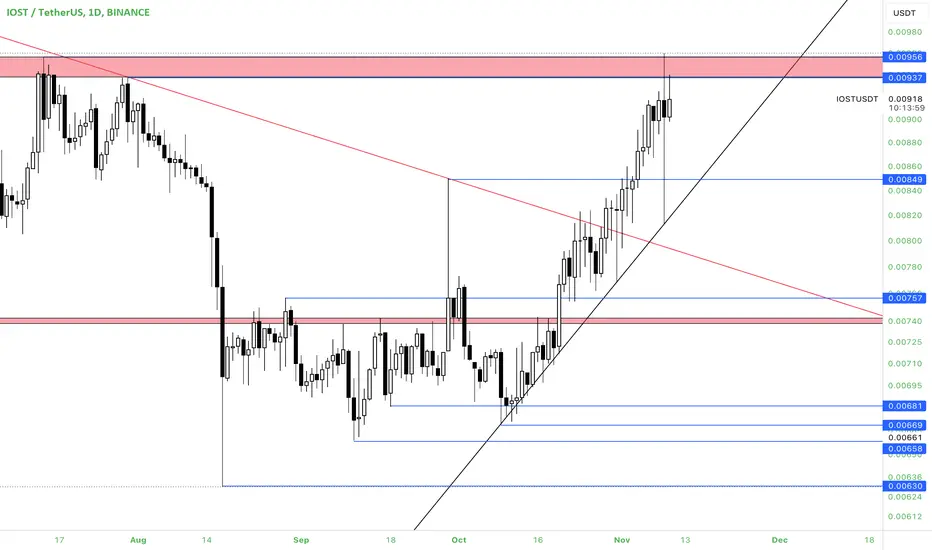
Internet Of Services | Chart Secrets Revealed!Here is another one: Three white soldiers (in this case green); which means three consecutive sessions closing green.
IOSTUSDT
➖ Moving weekly above EMA50 with higher lows since August 2023.
Let me share this with you.
Please, look at Solana vs Tether (SOLUSDT) or Bitcoin vs Tether (BTCUSDT).
Notice the same chart as this one but the price instead of being near their 2023 lows, can be found near their early 2022 or late 2021 highs.
And that's all you need to know.
➖ Those at the bottom, are set to go up.
➖ Those at their highs, are set to go down.
The potential mapped on the chart can happen within 1-3 months.
This would be followed by a higher low correction and then maximum growth.
Namaste.
IOSTUSDT trade ideas

IOST for long term 330-540 day to Segment3 (M3) +2570%Interesting price zone to buy and hold long term for 1-2 years, Calculated from Fib time base, takes 33%-61.8% of M2, takes approximately 300 days to 500 days. target price 0.15295 usd Calculated from 100% of M1

IOSTUSDT IDEAUPDATE
Formed Falling Wedge in 1W Time frame.
Breakout can lead 60-65% Bullish move 📈
COIN DETAILS
The live price of IOST is $ 0.009446 per (IOST / USD) with a current market cap of $ 201.34M USD. 24-hour trading volume is $ 14.90M USD.

I MUSTIOST has arrived at a great load-zone and has the potential for a massive swing to the following targets.
The major resistance R1 has been weakened throughout every lower high.
With BTC breaking out of its curved resistance mentioned below this gives most Alts an opportunity to become bullish.

iost preparing for solid recovery seems like preparing for solid recovery in coming weeks
consolidating in multi year symmetrical triangle and approaching towards upper descending trend line expecting breakout soon and successful breakout can lead 2 3x bullish wave midterm keep eyes on iost for confirmed breakout

IOSTUSDT - BULLISH OUTLOOKIOSTUSDT is exhibiting a bullish divergence on the 2-hour (2H) timeframe, indicating a potential shift in momentum. Additionally, it's approaching a crucial point where it's about to break its lower high level, suggesting a possible bullish reversal.
Based on this analysis, a trading strategy could be implemented as follows:
Entry: Consider entering a long position at the current market price of $0.00838.
Stop Loss (SL): Place a stop loss order at $0.00800 to manage risk and limit potential losses.
Take Profit (TP): Set take-profit levels to achieve a 1:1 and 1:2 risk-reward ratio:
TP1: Set the first take-profit level at $0.00876
TP2: Aim for the second take-profit level at $0.00914
This trading strategy anticipates a bullish reversal based on the observed bullish divergence and the potential break of the lower high level. However, it's crucial to monitor the price action closely and adjust the strategy according to changing market conditions.

Long from Day level, accumulation before level, free zone afterLong from Day level, accumulation before level, free zone after

IOST on a clear path to the upsideIOST is gearing for a bull move next. MACD is turning green. RSI is turning bullish. The stars are lining up.
Will there be wick down the bottom of the wedge to shake things out? If so I'll be sure to buy more.
NFA

#Iost/uasdt
#Iost
A 1x bullish rally is expected for the stock after the falling wedge pattern breaks out timeframe.

shoulder head shoulders and iost is probably going for 0.0135is ready to explode in the next days as it forms a simple shoulder head shoulder pattern that will probably make the price pump from the trading price which at the moment is 0.01008 to high of a 0.0135 which is a 33% profit

IOSTUSDTHi snipers, nothing is impossible. In the one-day time frame, the price has returned to the 103-day moving average. In case of breakout and stabilization above the 103-day moving average, there is a possibility of price growth again to high resistances. All analyzes are only possibilities.


Iost currency analysisWere in a long -term downward trend
That has been successfully drawn up and bought the whales upward
Can we make a purchase with the right lorj
Resistors are red lines
In the red lines you can put your final Target

IOST USDT (Long Trade Setup)Technical Analysis behind IOST USDT trade:
1. Supported by the immediate support area & Trendline
2. Bullish Harami pattern formed, a bullish sign.
3. Supported by the 200 Days SMA.
4. RSI is at 40, a bullish sign.
5. Volume analysis also supports the trade.

IOST - Bullish Channel, Watch VolumeOSTUSDT is in a unobstructed bullish channel with consistent ranges indicating heavy algorithmic trading activity.
Given the small decimalization of it's price it could attract participants looking to get fast exponential gains.
Watch for increases in Volume to confirm breaks above/below entry levels.

Iost 3d is bullish but... Iost 3d is bullish if it closes above the trend and the current yellow area
Don't rush and wait for the confirmation
If it closes above the area mentioned, then your SL will be closing 1d below the Vol. Bottom
The targets will be the POC and the 618 fibo
If the price closes and remains above them, then it moves upward toward point C
All the best insha Allah!

IOSTUSDT Watch that Level LIQ IN1-Apply your own risk management.
2-Daily and Weekly Targets
3-Hunt the profits at any level you see convenient for you.
4-Raise Your SL any time the price moves up or down to protect your profits
5-Use 8% Spot
6-Long it With 5% LEV7
Entry at 0.0097/0.0092

HTF Long IOST, Potential inverse head and shouldersA really nice HTF chart setup with potential inverse head and shoulders. Currently a good region to accumilate around 0.02$. If bulls can flip S/R over the second half of this year we could explode higher.

IOST Inverse Head and Shoulders (HTF) PART 2Our target was hit in our first chart for IOST.
We now need to look for a weekly close above the resistance and turn it into support. We can then work in this new channel forming with upper targets in the green box. Taking profit anywhere in this region will be considered a win.
Looking for a great/perfect exit will require further analysis on a lower time frame (LTF), but for now, the green box is roughly the target.
Thanks.

IOST accumulation for almost a yearIOST accumulation for almost a year
This is the Weekly Time Frame
This is a Long Term Hold Idea
if price retraces to 0.00681 area
this would be a nice entry
Looking for a break and support bounce
off the 0.01202 level
This is for ENTERTAINMENT purpose Only.
Not Financial Advise
Always DYOR ( do your own research )

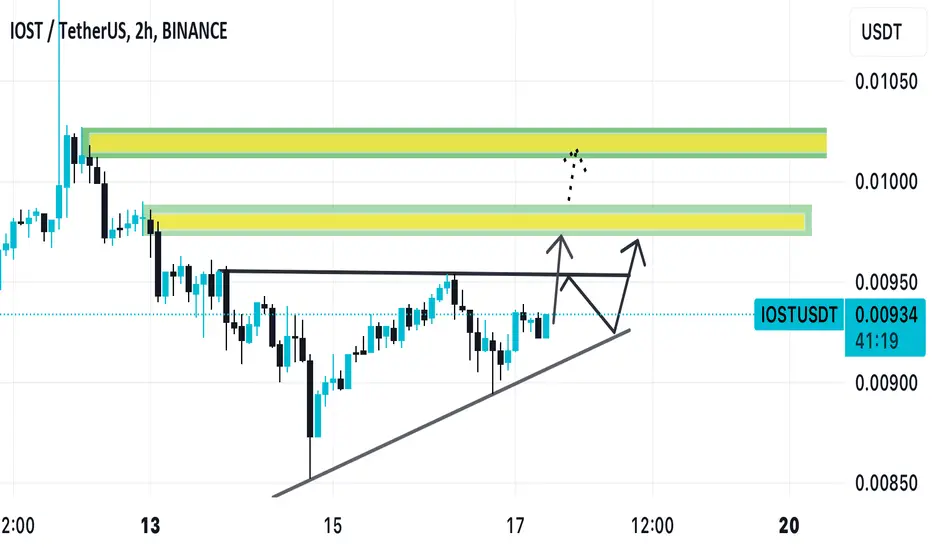
Bullish scenario for $IOSTIf we break above this structure then my target will be the liquidity pools above, we might get a retest before the bullish continuation if we couldn’t break above the structure
Goodluck on $IOST
IOST is leaving its bear market behindIOST is about to pump. I think it will hit $0.50 next year. Cheers!
This is NOT financial advice.

IOST-DAILYThese are my Keylevels for IOST.
Bearish trend line broken and now we have this bullish trend but not HH on W, so dont hurry with long positions on it.