IOST has a very good investment opportunity Hi Everyone;
today we have a good risk to reward Investment opportunity
it is more than 420 times the risk and the chart is look very promising.
I expect breaking the previous bear market key point will clear the way to the final target
IOSTUSDT trade ideas

IOSTUSDT TODAYPLZ DO NOT SELL MY SIGNALS
1-Apply your own risk management.
2-Daily and Weekly Targets
3-Hunt the profits at any level you see convenient for you.
4-BLUE Zone for entry,
5-Yellow levels are targets.
have a good day guys.

IOST SHORT 1HHello friends,
Given the current market conditions, short trading can be appropriate. For this asset, you can enter in two steps, with the first step being marked by a black dotted line and the second step set at 0.008969. In the first step, you can follow the position down to the bottom of the descending channel.
Thank you for your time and wishing you a profitable and healthy trading experience.

iost usdt DAnalysis and purchase order
With capital management
The limit of profit and loss is clear


IOST/USDT - IOST: SuperTrend Resistance_Breakout_Confirmation◳◱ We have identified both a Super Trend pattern and a Resistance Breakout on the $IOST / CRYPTOCAP:USDT chart. Both indicators are signaling a bullish trend, with the Super Trend showing a bullish trend and the Resistance Breakout confirming this trend by showing the price breaking above a key resistance level. Given the alignment of these signals, it may be a good idea to consider entering a long position and targeting higher levels. Our analysis indicates that the key resistance levels are at 0.01282 | 0.01467 | 0.01771 and the major support zones are at 0.00978 | 0.00859 | 0.00555. However, it is important to also consider other factors such as overall market conditions and other technical indicators before making a trade decision.
◰◲ General info :
▣ Name: IOST
▣ Rank: 166
▣ Exchanges: Binance, Kucoin, Bybit, Huobipro, Gateio, Mexc
▣ Category/Sector: Infrastructure - Smart Contract Platforms
▣ Overview: IOSToken (IOST) is building a proprietary blockchain, called Internet of Services (IOS), focused on scalable and high throughput smart contract processing.
◰◲ Technical Metrics :
▣ Mrkt Price: 0.01181 ₮
▣ 24HVol: 2,430,054.548 ₮
▣ 24H Chng: 2.785%
▣ 7-Days Chng: 6.06%
▣ 1-Month Chng: 16.58%
▣ 3-Months Chng: 25.31%
◲◰ Pivot Points - Levels :
◥ Resistance: 0.01282 | 0.01467 | 0.01771
◢ Support: 0.00978 | 0.00859 | 0.00555
◱◳ Indicators recommendation :
▣ Oscillators: BUY
▣ Moving Averages: STRONG_BUY
◰◲ Technical Indicators Summary : STRONG_BUY
◲◰ Sharpe Ratios :
▣ Last 30D: 1.20
▣ Last 90D: 1.41
▣ Last 1-Y: -0.74
▣ Last 3-Y: 0.89
◲◰ Volatility :
▣ Last 30D: 0.76
▣ Last 90D: 0.99
▣ Last 1-Y: 0.86
▣ Last 3-Y: 1.32
◳◰ Market Sentiment Index :
▣ News sentiment score is N/A
▣ Twitter sentiment score is 0.56 - Bullish
▣ Reddit sentiment score is 0.53 - Bullish
▣ In-depth IOSTUSDT technical analysis on Tradingview TA page
▣ What do you think of this analysis? Share your insights and let's discuss in the comments below. Your like, follow and support would be greatly appreciated!
◲ Disclaimer
Please note that the information and publications provided are for informational purposes only and should not be construed as financial, investment, trading, or any other type of advice or recommendation. We encourage you to conduct your own research and consult with a qualified professional before making any financial decisions. The use of the information provided is solely at your own risk.
▣ Welcome to the home of charting big: TradingView
Benefit from a ton of financial analysis features, instruments and data. Have a look around, and if you do choose to go with an upgraded plan, you'll get up to $30.
Discover it here - affiliate link -

IOSTUSDT 2H HR MTIOST
The beginning of the third wave
Back from the 0.382 Fibo area
The third touch of the upward trend
TP
Move up to the 1.424 Fibonacci area
A point where you can buy from a long-term perspectiveHello?
Traders, welcome.
If you "Follow", you can always get new information quickly.
Please also click "Boost".
Have a good day.
** Analysis of the BTC chart publishes new ideas once a week.
** However, we publish new ideas when volatility occurs or when we show signs of diverging from our expectations.
** Excluding the above situation, BTC analysis is listed as a daily update.
-------------------------------------
(IOSTUSDT chart)
(1W chart)
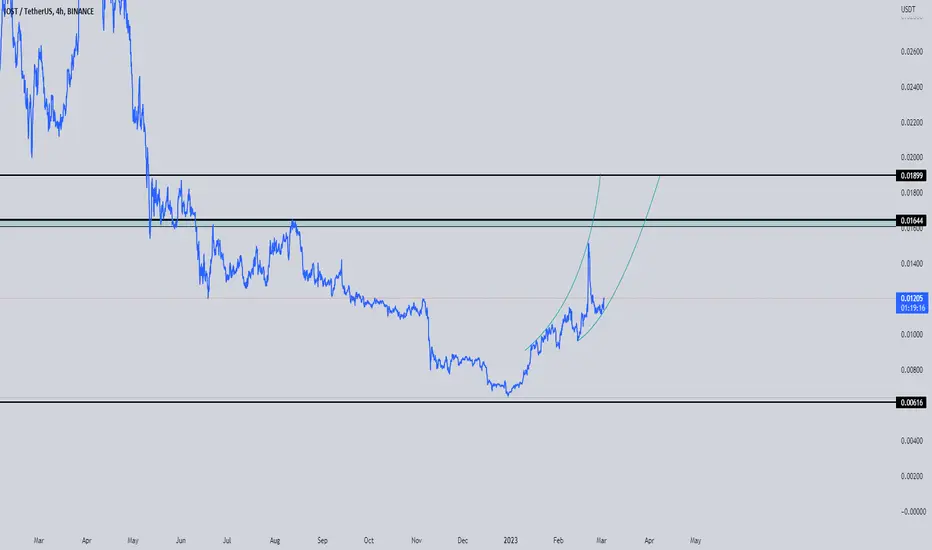
The question is whether the price can sustain the rise above 0.01361.
It is important whether it rises above the HA-High index or shakes up and down to make the HA-High index fall.
If it fails to rise above 0.01361, it should check for support near 0.00746.
(1D chart)
The 0.01144 point is the HA-Low indicator point on the 1M chart.
Therefore, finding support around 0.01144 means buying is possible from a long-term perspective.
Therefore, the key is whether it can rise with support around 0.01144.
I think the point where a full-scale uptrend is expected to start is when it rises above 0.02150.
However, we need to see if we can make the HA-High indicator on the 1W chart decline while moving sideways in the 0.01631-0.02150 range.
-------------------------------------------------- -------------------------------------------
** All descriptions are for reference only and do not guarantee profit or loss in investment.
** Even if you know other people's know-how, it takes a considerable period of time to make it your own.
** This is a chart created with my know-how.
---------------------------------

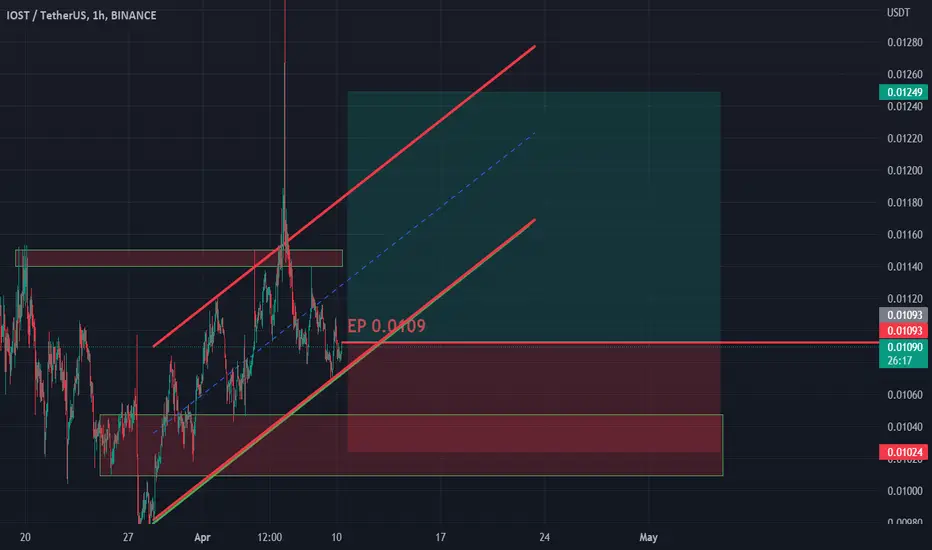
IOST/USDT - IOST: Resistance_Breakout◳◱ A Resistance Breakout has been identified on the $IOST / $USDT chart. The price has broken above a key resistance level, indicating a potential bullish trend. The next resistance key levels are located at 0.01078 | 0.01177 | 0.01391, and the major support zones can be found at 0.00864 | 0.00749 | 0.00535. Consider entering at the current price zone of 0.01109 and targeting higher levels.
◰◲ General info :
▣ Name: IOST
▣ Rank: 166
▣ Exchanges: Binance, Kucoin, Bybit, Huobipro, Gateio, Mexc
▣ Category/Sector: Infrastructure - Smart Contract Platforms
▣ Overview: IOSToken (IOST) is building a proprietary blockchain, called Internet of Services (IOS), focused on scalable and high throughput smart contract processing.
◰◲ Technical Metrics :
▣ Mrkt Price: 0.01109 ₮
▣ 24HVol: 2,906,086.411 ₮
▣ 24H Chng: 5.922%
▣ 7-Days Chng: 20.74%
▣ 1-Month Chng: 5.55%
▣ 3-Months Chng: 51.59%
◲◰ Pivot Points - Levels :
◥ Resistance: 0.01078 | 0.01177 | 0.01391
◢ Support: 0.00864 | 0.00749 | 0.00535
◱◳ Indicators recommendation :
▣ Oscillators: NEUTRAL
▣ Moving Averages: STRONG_BUY
◰◲ Technical Indicators Summary : BUY
◲◰ Sharpe Ratios :
▣ Last 30D: 0.31
▣ Last 90D: 1.52
▣ Last 1-Y: -0.45
▣ Last 3-Y: 0.93
◲◰ Volatility :
▣ Last 30D: 1.36
▣ Last 90D: 0.96
▣ Last 1-Y: 0.95
▣ Last 3-Y: 1.33
◳◰ Market Sentiment Index :
▣ News sentiment score is N/A
▣ Twitter sentiment score is 0.56 - Bullish
▣ Reddit sentiment score is 0.53 - Bullish
▣ In-depth IOSTUSDT technical analysis on Tradingview TA page
▣ What do you think of this analysis? Share your insights and let's discuss in the comments below. Your like, follow and support would be greatly appreciated!
◲ Disclaimer
Please note that the information and publications provided are for informational purposes only and should not be construed as financial, investment, trading, or any other type of advice or recommendation. We encourage you to conduct your own research and consult with a qualified professional before making any financial decisions. The use of the information provided is solely at your own risk.
▣ Welcome to the home of charting big: TradingView
Benefit from a ton of financial analysis features, instruments and data. Have a look around, and if you do choose to go with an upgraded plan, you'll get up to $30.
Discover it here - affiliate link -

Iost Looking Extremely Bulish Seems Like iost has Already bottomed out and getting ready for massive Recovery
forming descending Channel In htfs While testing horizontal Resistance
Macs cross Over about to happen Another confirmation Of Iost Strength
Incase Of resistance And trendline breakout Expecting 300%+ Bullish Wave

$IOST | LONG | TRADE$IOST | LONG | TRADE
Entry Conditions:
| Broken Local Resistance and out of ascending triangle consolidation
| Flipped 200 DEMA
| Broken RSI Trendline and Resistance

Eliot Waves for IOSTI am expecting IOST to 0.01215, then a small retrace, to retest the 0.01130 level and then the pump to 0.01435

IOSTUSDT 2H HR MTiost is at the beginning of its third wave and technically it should move up to 618 Fibonacci extension.

IOSTIf we can hold this area, which is so important as you can see
our target could be 0.5 ($0.0111)
it just an idea don't take it serious please.

IOST : INCREASE VIEWIOST showing an interesting trend for increase.
WE will follow it to see if its able to gain into uptrend coming 24H
it's time to going up for IOSTUSDTbefore buying, please check for being sure about your opinion about this CRYPTOCURRENCY!!!
(in every target you want, closed the position but our target is the third one)
*Guy's the entry place is importance things in enter in a position and be careful do not going up your leverage over 7x ,all things it's about risk management*
*************************************************
if you want to enter in this position:
Enter Price: 0.011567
(the position is active when crossing up white zone)
Target1: 0.011698
Target2: 0.011877
Target3(Final Target): 0.012058
Stoploss: 0.011401
*************************************************
Guy's if this idea was useful and it was intresting for you please follow for more
don't forget do comment and like my idea
doing and living in the best quality
thanks of all of you dear's ;)

IOST currently at key pointHi, IOST is currently at perfext and easy position - both scenarios marked
IOSTUSDT perfect continuation of the trendYet another coin bouncing off the trendline super precisely. This is a strong bullish sight and we can capitalize on this great RR buying opportunity.

IOST coin formed bullish BAT for upto 37.50% pumpHi dear friends, hope you are well and welcome to the new update on IOST coin with US Dollar pair.
Previously we caught a nice pump of IOST as below:
On a 4-hr time frame, IOST has formed a bullish BAT pattern for another bullish reversal move.
Note: Above idea is for educational purpose only. It is advised to diversify and strictly follow the stop loss, and don't get stuck with trade

IostThis going to go long rightnow it's in consolidation time however it can blast anytime soon target 0.18 to 0.22

#storj vs #iostcan storj follow iost?
it it does then get ready for 50% shoot in #storj ..
invalidation is below 0.4572

Iost Looking Extremely Bulish Over All Forming Descending Channel In 2day timeframe also Testing Cricial Horizontal Resistance Too
Once Trendline + Horizontal Resistance Got cleared Iost Bounce Will Be Epic
Expecting 220 to 240% bulish move Incase Of breakout

( IOT + blockchain ) name IOSThello dear trader
see this price action
iost in 4h timeframe has bulish patern ( inverted head and shoulders)
and to the dayli time frame in the strong support zone
you can see this fundamental and price action of iost in my youtube
good luck
