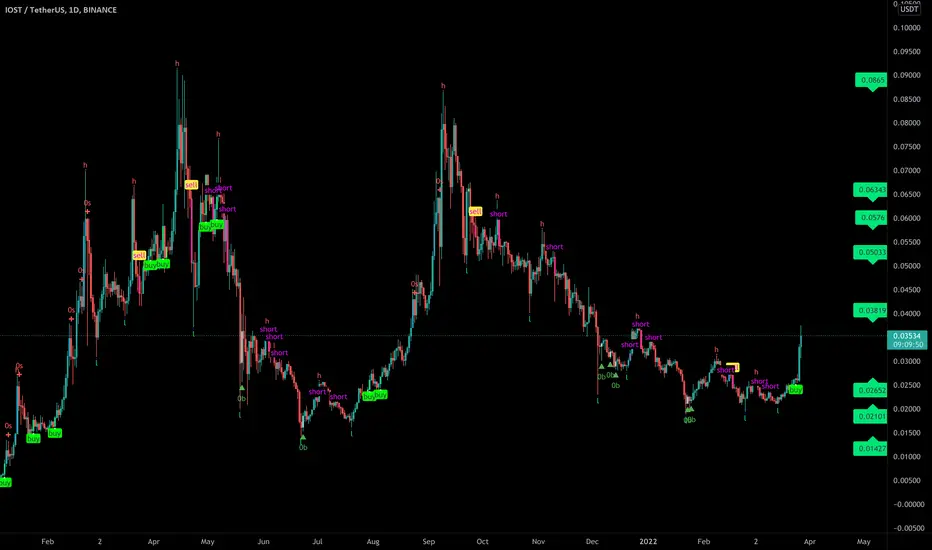
IOST Bullish signalsAfter a very steep drop-off for IOST (Internet of Services), we finally have a bullish signal in the mix.
We could simply get stuck here in a triangle, however with how bullish other IoT/IoS tokens have been- I am continuing to be vigilant, even stuck with a margin position just under ~0.05.
Had the opportunity to get out at about ~T0.0474 but hung on.
♠️🤫🐿
IOSTUSDT trade ideas

iost/usdscalp iostt
i am bullish on this coin
so
i have three targets
u can see those on the chart
wish luck

IOST/USDTesting/tracking elliot wave theory. Please do not trade off idea without S/L. Not financial advice.
Link to previous chart:
We've broken out of the bull flag and wave 3 impulse is starting.

IOST Angular chart predictions (+)IoS and IoT technology is going to have a very big 2022.
I hopped on a bit late yesterday, getting in directly below 0T.05, @ ~T0.0494 currently waiting out this chop for IOST to facilitate another good rise.
This chart was sort of done on the fly, so it may not look too clean-- however I just wanted to put this out there.

IOST DAILY TREND REVERSAL (BULLISH)Hi guys ...
it is not a financial advise please do your own research .
Looks like this baby is BULLISH !
1. daily bearish trend line is broken
2. triple bottom
3. RSI overbought
4. we need a test of support
5. if plays out 64 % minimum
As a wise man said Yepi yoka yay
2k in
profit : 1280 $
stop loss : 340 $
Take care, trade safe , best regards

IOST LONG
On the 1D chart for $IOST, descending Channel has broken out of months of consolidation.
Over 100% potential returns.


$IOST.X/USDT - Long - Potential 33.35%$IOST.X/USDT - Long - Potential 33.35%
Exchanges: KuCoin, Binance, Huobi.pro
Signal Type: Regular (Long)
Entry Targets:
1) 0.0368
Take-Profit Targets:
1) 0.03688
2) 0.04191
3) 0.04581
Stop Targets:
1) 0.03221
Entry Trigger - TD9 followed by Vol Spike
Trailing Configuration:
Entry: Percentage (0.0%)
Take-Profit: Percentage (1.0%)
Stop: Breakeven -
Trigger: Target (1)

IOST/USDT BUYING SET UPIOST Valid retest after breakout EVE ADAM Double bottom , Also break minor falling wedge
MACD Bullish crossover on daily
Potential Continue upward Movement🚀
Target mentioned in the chart
Stoploss : $0.03
Risk : 10%

IOST PUMPIOST is ultra-fast, scalable and secure blockchain network based on the next-generation consensus algorithm “Proof of Believability” (PoB).
Buy signal before pump


IOSTThe IOST token rejects its own dynamic resistance and is exiting the top of the cloud and can start moving well towards the top targets, I myself enter the price of 0.02534. ((Friends of personal analysis, so keep an eye on it and check for yourself if you deem it appropriate to enter.))

💡Don't miss the great buy opportunity in IOSTUSD @IOST_Official
Trading suggestion:
". There is a possibility of temporary retracement to the suggested support line (0.02468).
. if so, traders can set orders based on Price Action and expect to reach short-term targets."
Technical analysis:
. IOSTUSD is in an uptrend, and the continuation of the uptrend is expected.
. The price is above the 21-Day WEMA, which acts as a dynamic support.
. The RSI is at 70
Take Profits:
TP1= @ 0.02652
TP2= @ 0.02786
TP3= @ 0.03055
TP4= @ 0.03248
TP5= @ 0.03498
SL= Break below S2
❤️ If you find this helpful and want more FREE forecasts in TradingView
. . . . . Please show your support back,
. . . . . . . . Hit the 👍 LIKE button,
. . . . . . . . . . Drop some feedback below in the comment!
❤️ Your support is very much 🙏 appreciated! ❤️
💎 Want us to help you become a better Forex / Crypto trader ?
Now, It's your turn !
Be sure to leave a comment; let us know how you see this opportunity and forecast.
Trade well, ❤️
ForecastCity English Support Team ❤️

IOST/USDT READY TO PUMP AFTER A LONG TIME!!Hello everyone, if you like the idea, do not forget to support with a like and follow.
Welcome to this IOST/USDT TRADE setup. IOST looks very promising here.
Breaks out from a falling channel after 6 months of a downtrend. It also tries to break 50ma. I'm expecting a good pump from IOST in this Altseson.
Entry range:- $0.023-$0.025
Target:- 150-200%
SL:- If any daily candle closes below $0.02
Buy some now and add more in dips.
If you like this idea then do support it with like and follow.
Also, share your views in the comment section.
Thank You!


Update For IOST/USDT Analysis 📈📉As I expected in the past analysis for IOST ,it was be able to exactly hit my TPs according to my prediction 🎯 more than 2000 % profit💰
so now!
-------------------------------------------------------------------------------------------------------------------
📊Technical
And as you can see on WEEKLY timeframe for IOSTUSDT it has printed some pattern look like btc( or maybe double top pattern ) and , we can see that 14EMA has been crossing under 20 ,50 ,100EMA respectively, and recently its ascending trend line was broken , thus we have alot bearish sign for it that maybe cusses more fall in medium term , but I think it probably have a quick upward movement as a pullback before more decline in the short term , so it can rise to VG or resistance zone in the next weeks or months or even drop more if loses the support zone ,and fall to Lower support level in this case .
anyway in order to have any possible rally in the long-term ,it should be able to go above the resistance zone and also descending trendline .
🛑resistance level: $0.04377 - $0.051 /// descending trend line
❇️support levels: $0.017 - $0.02 /// 0.00893
--------------------------------------------------------------------------------------------------------------------
👉This analysis is my personal opinion ,not a financial advice ,so do your own research.
💜 if you're a fan of my analyses PLZ follow me and give a big thumbs 👍 OR drop comment 🗯💭


SHORT IOST🪙 IOST/USDT 🔴 #SHORT
✅ Entry: 0.0266
🎯 Take-Profits:
1) 0.024700
2) 0.022490
3) 0.019600
4) 0.016290
5) 0.011790
6) 0.006730
🛑 Stop-loss: 0.028028 (5.4%)

IOSTUSDT IOST CHART
⬆️Buy now 0.02520
⭕️SL: Close bellow 0.0230
🔵TP @ 0.03040
🔵MOVE SL IN 0.02664
#AMINE_CHEBBI

IOST 2021 Pattern Repetition (+171% Potential Profits)Last year IOST vs Tether (IOSTUSDT) had a very strong bullish wave in the range of ~270% after a W pattern showed up.
This pattern came right after a strong correction and printed a higher low before prices started to grow.
We already have the correction and higher low... We are just waiting for the W pattern to be completed for the same results.
We are not guessing... It can happen or it cannot.
When we trade, we have a 15% risk on this one with over 150% of potential for growth... Definitely worth it, don't you think so?
The idea is to find good chart/trade setups with low risk and high potential rewards.
If we lose we only lose 15-20% of the trade, which only has a small portion of our capital.
If we win we win big...
Thanks a lot for the support.
Namaste.

IOSTUSDT TA : 02.26.22 : $IOST : +32% ✅As you can see the price after reaching and returning to The Bullish Order Blocks reacted positively and increase more than 32% . the Next targets are $ 0.02847 and $ 0.0323 .
All the supports and resistances are marked on the chart and everything is clear in this analysis , but , just in case , if you had any questions or doubts Please feel free to ask in the Comment section .
Follow us for more analysis & Feel free to ask any questions you have, we are here to help.
⚠️ This Analysis will be updated ...
👤 Arman Shaban : @ArmanShabanTrading
📅 26.Feb.22
⚠️(DYOR)
❤️ If you apperciate my work , Please like and comment , It Keeps me motivated to do better ❤️

IOSTIf this currency can be well supported in these areas, given the current bitcoin situation, these two scenarios may have happened.
