MIOTA Bullish Bias Remains StrongThe IOTABTC (MIOTA) pair continues strong while trading above EMA100 and EMA50, which tells us that the bulls are still in full control.
This is just a quick update/reminder, IOTABTC has potential for a strong jump anytime.
Patience is key.
Namaste.
IOTABTC trade ideas

MIOTA Looks Bullish, Can Grow 100%+ EasyCurrently we have a volume breakout for MIOTA (IOTABTC) and prices moving above EMA50.
We have the potential here for a strong bullish wave to develop.
For me, this is an easy call.
This is not financial advice.
Additional details on the chart.
Namaste.

IOTA/BTC Wyckoff Accumulation Schematic #2Chart show the possibility of the Wyckoff method chart pattern and it's target.

IOTABTC Technical Analysis⏳ Spot
💎 IOTABTC after breaking above the descending triangle the price has retested and successfully got rejected from the support line. After breaking above the wedge pattern we need to wait for the pullback and when the bullish setup formed again we can enter a trade.
🌐 Tradingview
💵 Invest Only 5% of your Portfolio
🎳 Entry/Pullback now or from 0.00002238 to 0.00002123
☕️ TP1 0.00002525
🍺 TP2 0.00002817
🍻 TP3 0.00003144
🍾 TP4 0.00003497
🍷 TP5 0.00003900
🍸 TP6
🍹 TP7
🎁 TP8
🚫 SL 0.00002123 to 0.00001986
Good Luck 🎲
Check the Links in Description and If you LIKE this analysis, Please support our page and Ideas by hitting the LIKE 👍 button. ❤️ Your Support is really appreciated! ❤️
Traders, if you have your own opinion about it, please write your own in the comment box. We will be glad for this.
Feel free to request any pair/instrument analysis or ask any questions in the comment section below.
We will have more FREE forecasts in TradingView soon
Have a profitable day 😊👍🏻

iota longiotalong, if we break the support it will be a nice spot buy.... but I see iota bounce again

IOTA/BTC is just getting started - next coin to be pumpedI love the buy setup for IOTA against the USDT and against the BTC. This goes to show, that the massive uptrend is about to start. Although if the price will produce a new lower low, this setup will be invalidated.
MIOTA vs Bitcoin Chart Analysis (IOTABTC #6)MOITA (IOTABTC) is giving out an air of recovery but somehow I am not fully convinced.
We see prices moving above EMA10 and the recent MACD bullish cross but when we look closer, we have a lower low compared to the recent July and August support.
We also have a descending channel rather than a falling wedge.
It will surely recover, we are bullish long-term but there is room for additional correction, keep this in mind before you trade.
Bullish above 0.00002285 in the short-term.
Any trading below this level and we aim for the 0.786 Fib. retracement level support.
This is not financial advice.
All the information is shared for learning/entertainment purposes only.
Thank you for reading.
Namaste.

Iota's pretty diamondAlmost done accumulating at the bottom. Expecting a nice movement into May next year. 8-10k sats seems easy. the only question is: will BTC be 15k, 60k, 100k or 200k when we get there.

Interesting observation - IOTA BTC, not so bullishOnce you are over invested, it is impossible to clearly see market condition - period.
Financial investing is simply psychological endeavour - period.
We are within the same range (red resistance and green support) since July 2019 - period.
Earlier pump of similar price movement resulted in a massive volume spike. This week isn't over yet, I doubt however we will see volume candle doubling in size over the next c. 18 hours.
Possibly recent information in regards to significant number of unhedged shorts on iotausd market added fuel to this short term squeeze - I'm curious to see what next week will bring to our crypto table. For now, since #iota pinned the top BB boundary I'm out, comfortably observing this interesting situation. I believe we are due for another retracement.

💡İOTABTC ANALYSIS💡Hello Friends
graph four-hour te viewed our bats Formation Boge ( Bullish Bat ) formation present
Volume momentum is coming from Processing Input too risky .risk manage my money is very important in this key process.
There are technical levels on the chart.
Tp1:0.00003200
Tp2:0.00003709
Tp3:0.00004185 trade
entry level :0.00002584 At the close of the 4-hour candle,
stoplos:0.00002014 I keep the level away from my own money management
. You can pull it close . IT IS NOT INVESTMENT ADVICE.
If you are using the analysis, do not forget to like and follow,
if there is something wrong with the formation, you can warn
Educational purposes
bat Formation Boge ( Bullish Bat )
Rules:
X / EU = 0.382 and 0.50 in
the EU / CD = 0.382 and between 0.886
BC / CD = 1,618 with between 2,618
XA / CD = 0.886

Right Angled Descending Broadening Wedge PatternChart show the possibility of the Right Angled Descending Broadening Wedge Pattern and it's target.

2.2x by December Inverse HnS And CnH!It will follow Coti as it also made inverse head and shoulders but this one made a cup and handle which most likely break the neckline to see a 2.2x might resist these marked zones

IOTABTC Technical Analysis
⏳ Spot
💎 IOTABTC has formed a triangle in the channel. It is also at the Support zone and I expect that we get a bounce at this zone. We might see a Bullish engulfing at this zone otherwise the price might go lower before it Heads up
🏁 Short Term
💵 Invest Only 5% of your Portfolio
🎳 Entry at market or 0.00002945
☕️ TP1 0.00003115
🍺 TP2 0.00003250
🍻 TP3 0.00003400
🍾 TP4 0.00003480
🍷 TP5 0.00003690
🍸 TP6 0.00003830
🍹 TP7 0.00004200
🎁 TP8 ___________
🚫 SL 0.00002820
Good Luck 🎲
Check the Links in Description and If you LIKE this analysis, Please support our page and Ideas by hitting the LIKE 👍 button. ❤️ Your Support is really appreciated! ❤️
Traders, if you have your own opinion about it, please write your own in the comment box. We will be glad for this.
Feel free to request any pair/instrument analysis or ask any questions in the comment section below.
We will have more FREE forecasts in TradingView soon
Have a Profitable Day

💡Don't miss the great buy opportunity in IOTABTCTrading suggestion:
". There is a possibility of temporary retracement to the suggested support line (0.0000307).
. if so, traders can set orders based on Price Action and expect to reach short-term targets."
Technical analysis:
. IOTABTC is in a range bound, and the beginning of an uptrend is expected.
. The price is above the 21-Day WEMA, which acts as a dynamic support.
. The RSI is at 46.
Take Profits:
TP1= @ 0.0000330
TP2= @ 0.0000348
TP3= @ 0.0000369
TP4= @ 0.0000383
TP5= @ 0.0000420
SL= Break below S2
❤️ If you find this helpful and want more FREE forecasts in TradingView
. . . . . Please show your support back,
. . . . . . . . Hit the 👍 LIKE button,
. . . . . . . . . . Drop some feedback below in the comment!
❤️ Your support is very much 🙏 appreciated!❤️
💎 Want us to help you become a better Forex / Crypto trader?
Now, It's your turn!
Be sure to leave a comment; let us know how you see this opportunity and forecast.
Trade well, ❤️
ForecastCity English Support Team ❤️

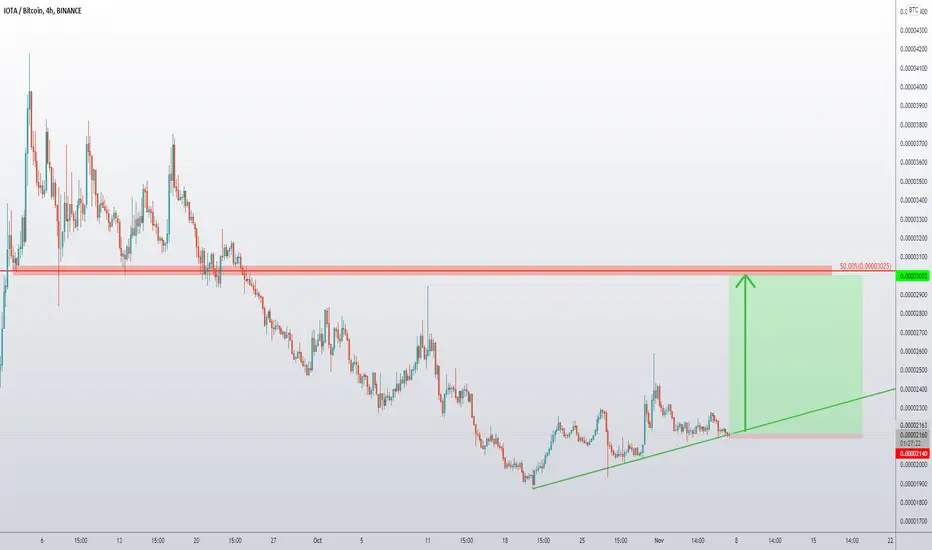
IOTABTC is creating a bull flag 🦐IOTABTC is creating a bull flag after a nice bullrun.
If the price is going to have a breakout, According to Plancton's strategy (check our Academy ), we can set a nice order
–––––
Follow the Shrimp 🦐
Keep in mind.
🟣 Purple structure -> Monthly structure.
🔴 Red structure -> Weekly structure.
🔵 Blue structure -> Daily structure.
🟡 Yellow structure -> 4h structure.
⚫️ Black structure -> <4h structure.

$IOTA, Aiming for a new leg up above ~3800 sats$IOTA
On a very similar structure to what you can find in many other assets i.e REN
Aiming for a new leg up above ~3800 sats as continuation as its showing a HH/HL structure and now showing increasing volume again..
UCTS bullish across HTFs
Wait for it
#IOTA

IOTABTC Wyckoff Accumulation Schematic - 2021-09-15 $IOTA Update$IOTA vs BTC still going according to plan.
Consolidation above 0.382
Cointelegraph:
The sudden surge in interest comes after the protocol integrated the Hornet update, which brought back the auto-peering feature and also integrated a faucet plugin with the Hornet node. This makes the process of running a private 'Tangle' easier.

Long term view / IOTA Waves possivle scenarioPossible scenariofor IOTBTC. Lets see how it goes in the next weeks.

IOTABTC Technical Analysis
⏳ Spot
💎 IOTABTC after the breakout of the resistance will go for a retest and then again will go up. It may go to the Pullback zone before it goes up.
🏁 Short & Medium Term
💵 Invest Only 5% of your Portfolio
🎳 Entry at market or 0.00002135
☕️ TP1 0.00002420
🍺 TP2 0.00002470
🍻 TP3 0.00002525
🍾 TP4 0.00002590
🍷 TP5 0.00002990
🍸 TP6 ___________
🍹 TP7 ___________
🎁 TP8 ___________
🚫 SL 0.00001955
Good Luck 🎲
Check the Links in Description and If you LIKE this analysis, Please support our page and Ideas by hitting the LIKE 👍 button. ❤️ Your Support is really appreciated! ❤️
Traders, if you have your own opinion about it, please write your own in the comment box. We will be glad for this.
Feel free to request any pair/instrument analysis or ask any questions in the comment section below.
We will have more FREE forecasts in TradingView soon
Have a Profitable Day

IOTABTC Wyckoff Accumulation Schematic - 2021-08-31 $IOTA Wyckoff accumulation schematic for IOTABTC
Bullish case
0.618 retracement is a high probability entry
Confluence with the trading range
NTA, DYOR

Here we go again IOTA - IOTA/BTC 1wLong term extrapolation.
- Resistance/support zones: white areas
- Wave 3 target: 1.618 or 2.618 fib extension
- Elliott's parallel channel in blue.
Also, the price is on ichimoku kumo cloud support.

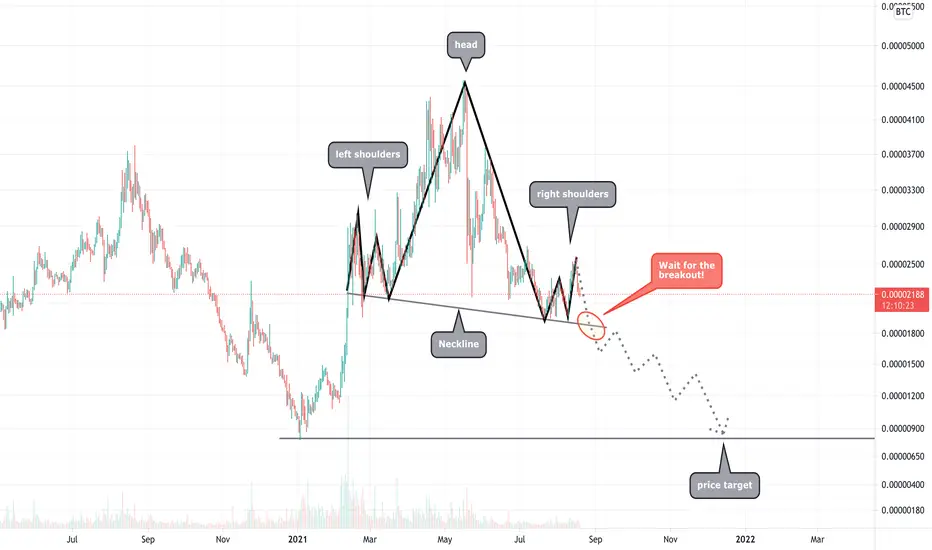
Possible market turnover lead by the IOTA/BTC pairI'll make this short and sweet and get straight to the point. The IOTA price is about to complete a big complex head shoulder top against Bitcoin .
There is not much difference between complex and "normal" head shoulder tops except in their appearance. If you add a couple of shoulders to the left and right of a simple head shoulder top, as in this case, you get the complex version of the chart pattern.
In theory, a complex head shoulders top is a reversal pattern. If the crossing of the neckline is waited for, it is also in practice a very reliable indication of a falling price. From a purely statistical point of view, only 8% of the formations fail the 5% criterion thereafter.
However, the neckline has not been breached yet. A breakthrough should be waited for in any case.
Normally, a minimum price target can be calculated for this chart pattern by measuring the height of the formation and projecting this distance downward from the neckline. However, this makes little sense in this case, as it would result in a price target below 0 sats .
Accordingly, a retest of the previous low at just under 850 sats would be the more appropriate price target.
This price target is about 60% below the current price. However, due to the correlation in the altcoin market, it is unlikely that such a sharp price drop would affect IOTA alone.
It might therefore be worth keeping a close eye on this development.