IOTAUSD trade ideas


IOTA/USD: UPTREND| PRICE IS GROWING FAST....Welcome back Traders, Investors, and Community!
Check the Links on BIO and If you LIKE this analysis, Please support our Idea by hitting the LIKE 👍 button
Traders, if you like this idea or have your own opinion about it, please write your own in the comment box . We will be glad for this.
Feel free to request any pair/instrument analysis or ask any questions in the comment section below.
Have a Good Day Trading !

Maybe turnaround at 1.2 - 1.1MIOTA is still far behind $BTC or $ETH performance.
When the chart turns @ around 1.2 - 1.1 we can go long till upper flag site and go for the breakout...

MIOTA Perp. MIOTA Perp. forming a bearish butterfly. let`s see if we are going down once more, or if we can see higher highs without going any deeper.


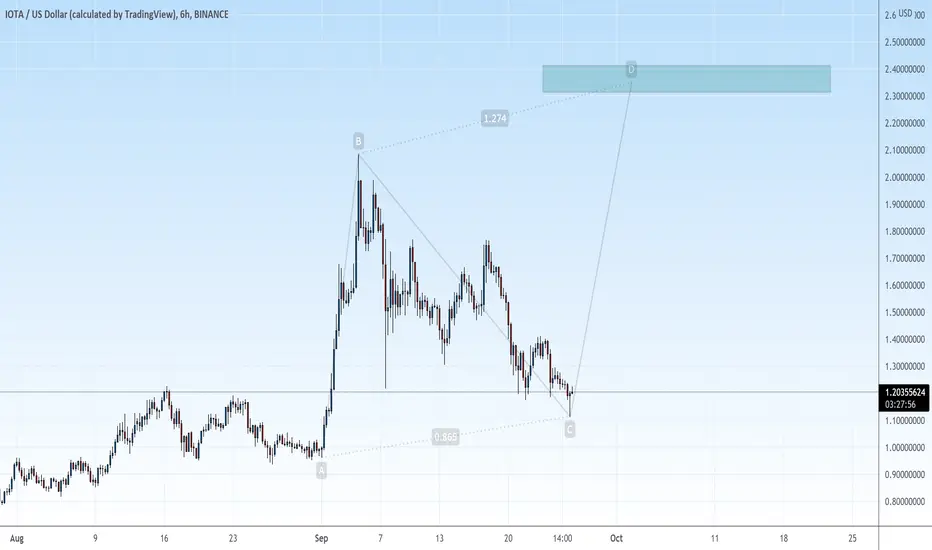
iota/usdTesting/tracking elliot wave theory. Please do not trade off idea without S/L. Not financial advice.
I have been getting a lot of questions on "time" and I can't predict the future so I can't give you a time... Ain't nobody here charting with a crystal ball. Here is an example of Elliot wave price predictions. The timing that I want is within the white wave, but I can't predict the future lol nor can I call the top or bottom. I am using the general rules of elliot wave theory to try and give you an accurate price prediction. The red wave being the fastest wave, blue wave being the middle, the white wave is my prediction and the purple wave is also possible, lagging behind my prediction. With that being said, the wave count on any of these is possible. The purpose of elliot waves is to give you a general idea of price action so you can time your entry and exits. Any of these wave counts can go a bit higher or lower as no one have a crystal ball and this is just a general idea of price action movement.


Best way to trade bull flags #btc #iota #chartpatternIt is called a flag pattern because when you see it on a chart it looks like a flag on a pole and since we are in an uptrend it is considered a bullish flag.
I sent this signal at my previous post and now that the pattern is pretty much completely, here is how i like to do:
At this point the best is, i am selling 75%, moving the stoploss to breakeven and letting the rest ride.

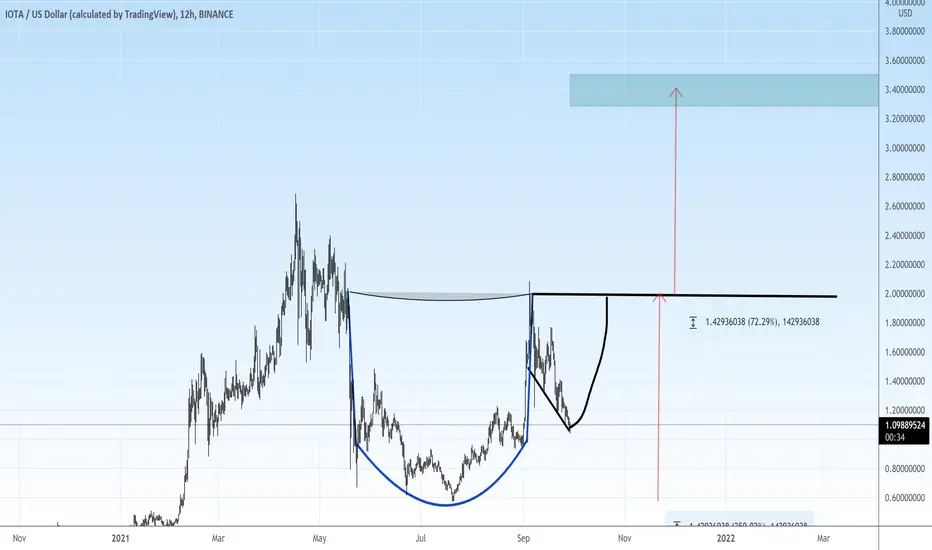
Cup And Handle PatternChart shows the possibility of the Cup And Handle Chart Pattern and it's target.

IOT/USD approaches potential resistance at 1.44
If you missed the original run from 1.20 and the break out at 1.33, then there might be an opportunity to get in if the price pulls back to current support estimates at 1.38, 1.33, and 1.27.
The current trend looks very strong to the upside; however, we all know there is always a pullback in an uptrend, which could be an opportunity to get in.


IOTAUSD uptrend channelThe price is within the uptrend channel ,we expecting in the coming month price of iota to be around 6$ before going parabolic once again just as 2017 bull market

Bull Flag Trading #IOTA #BTCThe bull flag pattern is a continuation chart pattern that facilitates an extension of the uptrend.
In this scenario we have a Bull Flag formed after a Morning Star Reversal Candlestick Pattern.
This pattern has a 67% probability of succeeding to the upside.
Entry Possibilities for a Bull Flag are:
At the Bottom of the Flag
At the Breakout of the Flag
Take Profit i always like to take at 50% of the measure move and at the 90%. This is a momentum pattern and more often than not, at the measured move, price will likely retrace a good amount.
Please support our work with like & comment!
#BTC #CRYPTO #BULLFLAG #BEARFLAG #TRADINGIDEA

Cup and handle on the weeklyA cup and handle is a technical chart pattern that resembles a cup and handle where the cup is in the shape of a "u" and the handle has a slight downward drift. A cup and handle is considered a bullish signal extending an uptrend, and is used to spot opportunities to go long.

IOTA +60% RUN, OR DO WE GO FURTHER DOWN?Hello Cryptnonauts
Let's take a look at IOTA! Recently we just saw IOTA Facing a new resistance Level between around 1.3275 and 1.3475. After a quick bounce away from that resistance, we are now looking forward to rechallenging this level.
So, therefore, you might ask if you should go and buy a potential breakout or maybe short at the resistance? These are good questions, and I try to give you a few possible setups that might appear.
Let's Take a look at the Bigger Picture first!
On the 1 Hour chart, we see that we are in a significant trend facing the bottom side. So generally speaking, a movement further down might be more likely at this point. But a trend can break every time, so we are also looking at the potential longs.
So let's go and cover a few potential scenarios.
Scenario 1 (Short) down to the support level
1Hour Chart
5Min Chart
At our Short scenario, we might move now a little bit more up until we either hit the resistance level or the red Trendline and push back from there down to our support level around 1.0400
So for potential entries, we would look at movements that are moving back to the downside from those levels.
Scenario 2 (Short) down into a Sideways Market and a potential Trendline break
In our second Short scenario, we are looking for a potential ending in a sideways market until we break the trend line for a bullish movement.
We are looking at the same Setup as in our first Short scenario but with another target.
Same Chart Setup for the Short position
Facing the new build support?
In this scenario, we are now looking at the new build support from the price bounce around 1.2000.
That level might end up in new support since 1.2000 also is a pretty easy number to trade, and it might stick in traders' heads for potential long positions. That's why we might end up in a sideways market, which has a great potential to break the overall downtrend and end up in a bullish market.
Scenario 3 (Long) Trend and Resistance level Breakout
Once Again, we are looking basically at the same chart, but with two potential breakouts this time. We can either directly break entirely through the resistance and trend levels or, what I believe would be more likely, break through the first Trendline, turn the resistance into a support for a price correction and then continue to breakthrough.
direct breakthrough
Trend Breakthrough with a minor price correction to the past resistance that then acts as support before we entirely turn into a bullish trend.
Those are the potential setups and movements I am looking into to make some trades. I hope I could give you some insights into my thoughts.
Happy Trading

Cup And Handle Chart PatternChart shows the possibility of the Cup And Handle Chart Pattern and it's target.

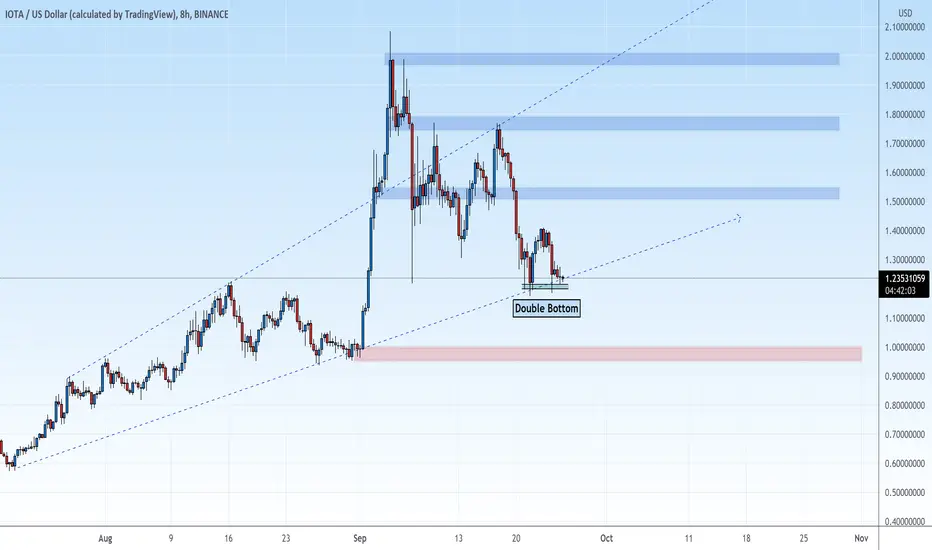
Double Bottom Chart Pattern - IOTAUSDChart shows the possibility of the Double Bottom Pattern and it's target.

IOTA breakout? - bullish falling wedgeIOTA shaped a bullish falling wedge. This would be the second outbreak of IOTA in the falling wedge.
Support at 50-MA-daily.

IOTAUSD - bullish falling wedgeIOTA formed a bullish falling wedge.
Resistance at 21-EMA-daily- line.
Just an idea
