IOTAUSD trade ideas

IOTA (MIOTA) - September 15Hello?
Welcome, traders.
By "following", you can always get new information quickly.
Please also click "Like".
Have a nice day.
-------------------------------------
(IOTAUSD 1W Chart)
If the price is maintained above the 0.57391761-0.70752520 range, we expect the uptrend to continue.
In particular, if the price is maintained above the 1.20630784-1.70386253 range, it is expected to create a new wave.
(1D chart)
We need to find support near the critical 1.40242016 point and see if we can continue the uptrend.
If it goes down, you should check to see if it finds support at the 1.07896204-1.20630784 zone.
If it falls in the range of 1.07896204-1.20630784, it may fall below the 0.79672550 point, so Stop Loss is required to preserve profit and loss.
If it moves above the 2.01140741 point and breaks out of the downtrend line, the uptrend is expected to accelerate.
It is important to be able to break through the resistance section formed in the 2.33397396-2.48227711 section strongly upward.
-------------------------------------
(IOTABTC 1W chart)
If the price maintains above the 2993 Satoshi point, it is expected to break out of the consolidation zone and turn into an uptrend.
However, in order to create a new wave, the price must rise above the 6200 Satoshi point to maintain the price.
(1D chart)
If support is found in the 3231 Satoshi-3524 Satoshi section, the uptrend is expected to continue.
If it goes down, we should see if it finds support at the 2993 Satoshi point.
If it falls from the 2993 Satoshi point, a short-term Stop Loss is required.
If it falls in the 1768 Satoshi-2061 Satoshi range, it may enter the mid- to long-term investment area, so careful trading is required.
------------------------------------------
We recommend that you trade with your average unit price.
This is because, if the price is below your average unit price, whether the price trend is in an upward trend or a downward trend, there is a high possibility that you will not be able to get a big profit due to the psychological burden.
The center of all trading starts with the average unit price at which you start trading.
If you ignore this, you may be trading in the wrong direction.
Therefore, it is important to find a way to lower the average unit price and adjust the proportion of the investment, ultimately allowing the funds corresponding to the profits to regenerate themselves.
------------------------------------------------------------ -------------------------------------------
** All indicators are lagging indicators.
Therefore, it is important to be aware that the indicator moves accordingly with the movement of price and volume.
However, for the sake of convenience, we are talking in reverse for the interpretation of the indicator.
** The MRHAB-O and MRHAB-B indicators used in the chart are indicators of our channel that have not yet been released.
(Because it is not public, you can use this chart without any restrictions by sharing this chart and copying and pasting the indicators.)
** The wRSI_SR indicator is an indicator created by adding settings and options to the existing Stochastic RSI indicator.
Therefore, the interpretation is the same as the traditional Stochastic RSI indicator. (K, D line -> R, S line)
** The OBV indicator was re-created by applying a formula to the DepthHouse Trading indicator, an indicator disclosed by oh92. (Thanks for this.)
** Support or resistance is based on the closing price of the 1D chart.
** All descriptions are for reference only and do not guarantee a profit or loss in investment.
(Short-term Stop Loss can be said to be a point where profit and loss can be preserved or additional entry can be made through split trading. It is a short-term investment perspective.)

IOTAUSD - falling wedgeBullish falling wedge on IOTA.
Resistance: 200MA-daily-line at 1.31USD
Just an idea.

IOTA/USD Breaks Above $1IOTA / USD ANALYSIS
The IOTA price is trading bullishly and a breakout above the channel may trigger a rapid increase.
The daily chart reveals that IOTA/USD has now resumed the bullish continuation as the buyers gain control of the market. The 4.67% surge in volatility has leveled up the trading price at around the $0.96 resistance level. The MIOTA price is seen trading above the 9-day and 21-day moving averages.
Can MIOTA Price Keep the Uptrend?
According to the daily chart, the IOTA price has been increasing since July 21 and traders may see more climbs if the coin crosses above the upper boundary of the channel as the bulls are taking control of the market. On the downside, the 21-day moving average at $0.80 could provide support for a possible bearish retracement.
However, if the MIOTA price crosses below the moving averages, the coin may test the $0.72, $0.62, and $0.52 supports. As revealed on the Relative Strength Index (14), the signal line is crossing above 60-level and the current buying pressure is clearly revealed above this level. At the moment, we can say the MIOTA market is following a bullish scenario and the resistance levels are located at $1.20, $1.30, and $1.40.
IOTA/USD Market
Key Levels:
Resistance levels: $1.20, $1.30, $1.40
Support levels: $0.72, $0.62, $0.52
-For more chart analysis on the crypto market follow, and if you agree with this, like and share.


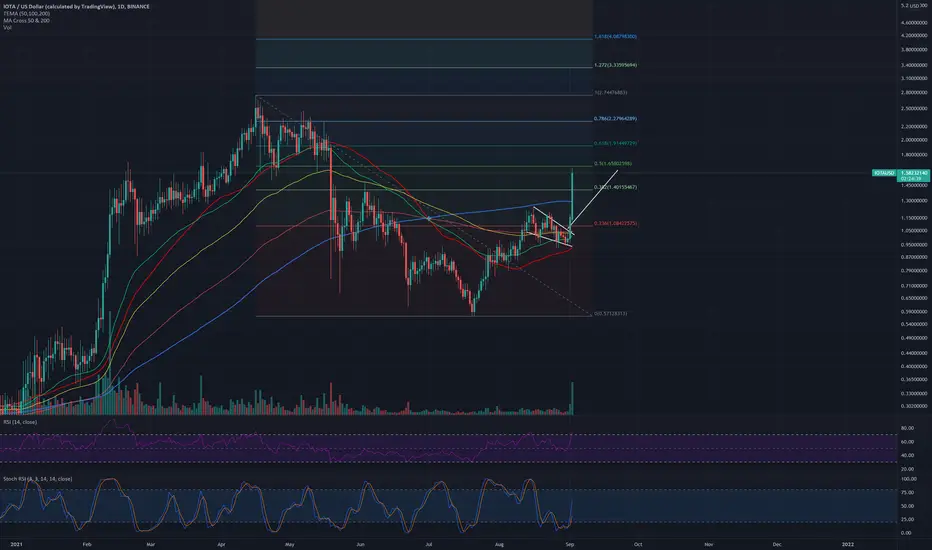
Iota BlastoffWeekly chart, RSI and Stoch RSI are perfectly aligned with 2017 bullrun.
Price target : $9++

IOTA/usd. cup with handleThe target level for this figure is the height of the cup, set up from the resistance level.

Continued price surge post normalisation?Just an idea: IOTAs consolidation during the past days post the high surge in the previous week might end soon.

IOTA Buy a break.IOTA - Intraday - We look to Buy a break of 2.112 (stop at 2.038)
We are trading at overbought extremes.
This provides an excellent risk/reward opportunity to fade the current bullish move.
A break of bespoke resistance at 2.100, and the move higher is already underway.
Our profit targets will be 2.334 and 2.389
Resistance: 2.100 / 2.200 / 2.300
Support: 2.000 / 1.900 / 1.800


IOTAUSD D4: 200% gains BEST level to BUY/HOLD (SL/TP)(NEW)Why get subbed to me on Tradingview?
-TOP author on TradingView
-2000+ ideas published
-15+ years experience in markets
-Professional chart break downs
-Supply/Demand Zones
-TD9 counts / combo review
-Key S/R levels
-No junk on my charts
-Frequent updates
-Covering FX/crypto/US stocks
-before/after analysis
-24/7 uptime so constant updates
🎁Please hit the like button and
🎁Leave a comment to support our team!
IOTAUSD D4: 200% gains BEST level to BUY/HOLD (SL/TP)(NEW)
IMPORTANT NOTE: speculative setup. do your own
due dill. use STOP LOSS. don't overleverage.
🔸 Summary and potential trade setup
::: IOTAUSD D4 chart review
::: still bullish outlook in IOTAUSD
::: massive gains recently
::: upside momentum intact for now
::: TP BULLS near 4.20 USD
::: right now more upside possible
::: recommend to BUY ANY DIPS
::: 1.50/1.60 USD great reload BULLS
::: BULLS maintain control until 4.20 USD
::: until we get a decent pullback
::: wait for the pullback now
::: before buying it
::: Speculative bullish setup
::: reload bulls is later maybe this week
::: strong mirror S/R level
::: 1.60 USD strong reload BULLS
::: get ready to BUY low / hold it
::: 200% gains possible from my level
::: strategy: BUY LOW after pullback
::: TP bulls is +200% gains BUY/HOLD setup
::: buy near my level and get rewarded
::: TP bulls is +200% or 4.20 USD
::: good luck traders
🔸 Supply/Demand Zones
::: dem/supp N/A
🔸 Other noteworthy technicals/fundies
::: TD9 /Combo update: N/A
::: Sentiment short-term: BEARS/CORRECTION
::: Sentiment outlook mid-term: BULLISH /200% PUMP
RISK DISCLAIMER:
Trading Futures , Forex, CFDs and Stocks involves a risk of loss.
Please consider carefully if such trading is appropriate for you.
Past performance is not indicative of future results.
Always limit your leverage and use tight stop loss.

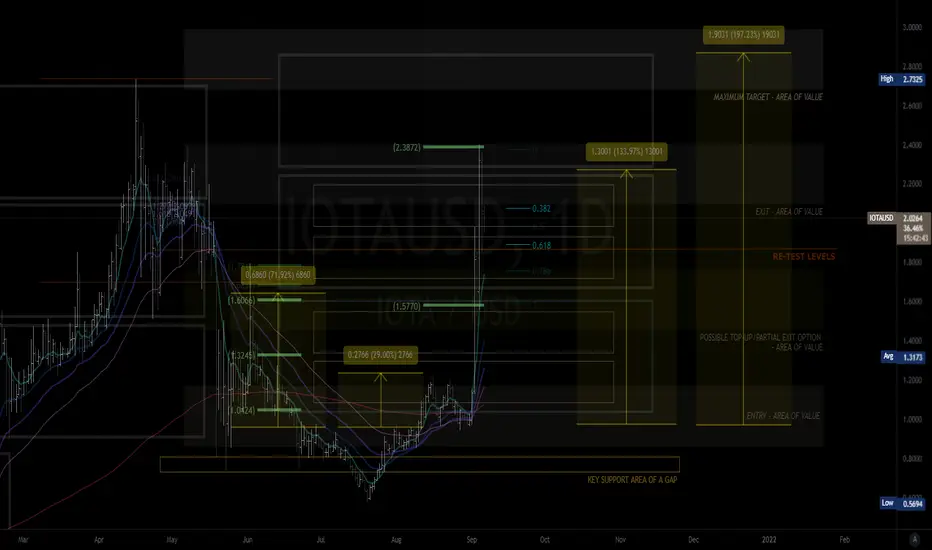
MY MINIMALIST CHART ANALYSIS 9.6.21
My Minimalist Analysis
CONGRATULATIONS! PARTIAL EXIT GUYS! BEEN A LONG WAY UP SINCE ENTRY. LOL!
Indicated are key levels of support and resistance using small and large range boxes TO ENTER A SWING TRADE (Short - Long).
Watch out for patterns, EMA, and your Fibs.
Further Analysis on price action is required on a 1HR-4HR chart when entering or closing a trade, depending on your risk appetite and trading style.
Disclaimer: The findings/predictions of the following analysis are the sole opinions of the publisher of this idea and should not be taken as investment advice.
If you like my published ideas and for more daily analysis, you can support my work by pressing the like and follow buttons on Trading View and Etoro Platforms.
Thank You for your appreciation and support.. www.tradingview.com
etoro.tw
IOTA pushing UPIOTA is currently witnessing profit-booking and it may drop to the first support at the 38.2% Fibonacci retracement level.
A strong rebound off this level will suggest that traders are buying on minor dips.
The bulls will then make one more attempt to push the price above $2.00 If they succeed, the pair could pick up momentum and rally toward $2.32 and then $2.63

IOTA $5 SOONIOTA has rallied over 70% in few days, it will break its preious ATH of $5.8 soon and maybe 2x it to 15$


IOTA vs 4 years downtrend channelAs of writing, $8 million short positions are still open. Combine that with all the progress IF and the community are delivering, plus the latent realization of severe limitations in blockchain based DLTs (Cardano Smart Contract most recently) there is a good chance IOTA is switching into a steep uptrend channel after 4 years of misery.

IOTA PRICE PREDICTION
The IOTA price rocketed higher as demand for the Internet of Things (IoT) cryptocurrency jumped. The coin rose to $1.7462, which was the highest level since May 19. This rally brought the total market capitalization of IOTA to more than $3.6 billion.
What is IOTA and how does it work?
IOTA is a blockchain project that was developed in 2018. It is a relatively different project from other popular platforms like Ethereum and Polkadot. For one, it is a platform that aims to help solve problems in the Internet of Things (IoT) industry.
IOTA achieves this through the tangle, which is a directed acyclic graph (DAG) that stores transactions. The tangle technology works in a different way than how blockchain works. Transactions within te network are issued by nodes that make up the tangle graph. In this case, when a transaction arrives, it must always approve the previous two transactions.
In the past few years, IOTA has achieved several partnerships. Indeed, some of the top level companies using this network are Dell Technologies, Jaguar Landrover, TradeMark East Africa, Zebra, and Ensuresec. Indeed, recently, we wrote about the deal between IOTA and TradeMark that will help streamline business within the East African Community.
IOTA price prediction
The daily chart shows that the IOTA price declined substantially in July, reaching a multi-month low of $0.5675. Since then, the coin formed an inverted head and shoulders pattern, which is usually a bullish sign.
The upward momentum of IOTA gained steam in the overnight session as it rose above the 25-day and 50-day moving averages. The two lines of the MACD have also been in a strong bullish trend.
Therefore, the coin will likely keep rising as investors target the key resistance level at $2.7284. This is a notable price that is its all-time high and is about 60% above the current level.

IOTA Long - Target $1.55 reachedSUMMARY: Long, can see this hitting the $3 mark by the end of the bull run 2021
Huge bull flag has played out, expect a retracement to the 200MA as a back test before continuation.
Please HIT the --->>> "LIKE" and "FOLLOW" button. <<<----
*Not financial advice and is for educational purposes only. Always DYOR.
IOTA/USD:UPTREND|WAITING FOR NEW BULLISH IMPULSE|LONG🔔Welcome back Traders, Investors, and Community!
Check the Links on BIO and If you LIKE this analysis, Please support our Idea by hitting the LIKE 👍 button
Traders, if you like this idea or have your own opinion about it, please write your own in the comment box . We will be glad for this.
Feel free to request any pair/instrument analysis or ask any questions in the comment section below.
Have a Good Day Trading !

Ascending Broadening Wedge PatternChart shows the possibility of the Ascending Broadening Wedge Pattern and it's target.

ABCDE Correction Triangle PatternChart shows the possibility of the corrective triangle pattern and it's target.

IOTAUSD - Rounding Bottom Chart PatternChart shows the possibility of Rounding Bottom / Cup&Handle chart pattern and it's targets.

IOTUSD Head And Shoulders Target: 0.69$IOTUSD Head And Shoulders Target: 0.69$ maybe we bounce off the neckline and the hs gets invalidated...
