IOTA/USDT Weekly Analysis – Critical Support Retest
📊 Pattern & Price Structure:
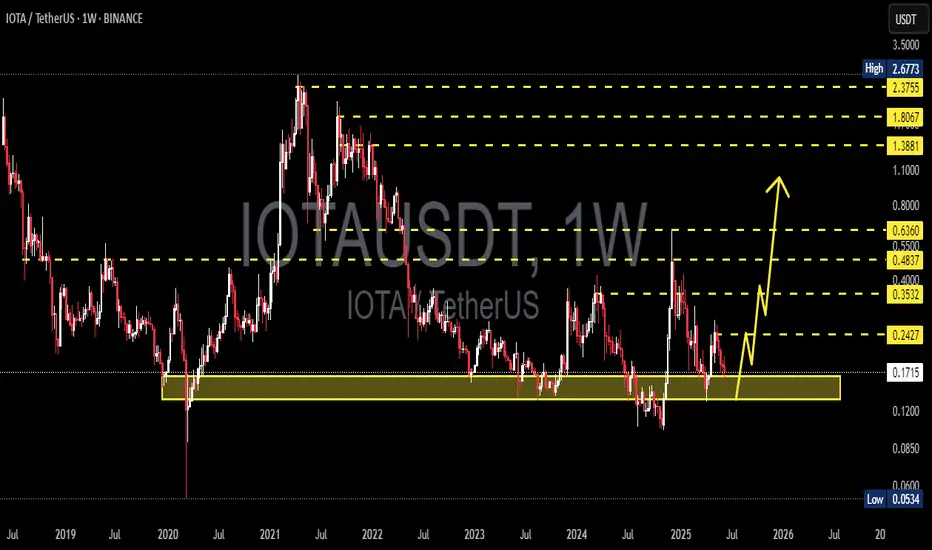
The chart indicates that IOTA is currently retesting a major historical demand zone in the range of $0.110 – $0.160, which has served as a strong support since 2020. The price has bounced off this area multiple times in the past, reinforcing it as a solid accumulation


IOTA?
Hi,
Last move.. IT took 30 days blooming into a fantastic beast.
Don't expect a short-term vaganza.
I wish all the best.
Below 0.145 is a No NO.. if you understand
Not a guru.

IOTA/USD PREDICTION**IOTA** is a unique distributed ledger technology designed specifically for the Internet of Things (IoT). Unlike traditional blockchains, IOTA uses a system called the **Tangle**, a directed acyclic graph (DAG) that allows for **feeless transactions** and high scalability. This architecture enables

IOTA Is Showing a Dangerous Pattern! Don't Ignore This SignalYello, Paradisers! Are you watching what’s forming beneath the surface of #IOTA’s slow drift? While the market sleeps on this coin, a dangerous structure is developing, and if this key support breaks, we could see a fast and painful selloff few are prepared for.
💎After months of low momentum, IOTA

IOTAUSDT 1W AnalysisIOTA ~ 1W Analysis
#IOTA Buy back gradually from here if you still have confidence in this coin with a short term target of at least 20%+ from here.
IOTA LONG TRADEIOTA Price made a Double Bottom and held the Major Support twice and showing minor signs of reversal to the upside, which is why I took the Long Position from the support and it's moving sporadically as predicted.
_THE_KLASSIC_TRADER_.

IOTA SHORT RESULT TP Done
Price moved just as Predicted.
Price accumulated on the Retest process and after the Successful retest of the resistance zone, it dumped just to our TP 😉💪✅
_THE_KLASSIC_TRADER_.
IOTAUSDT?
Hi
This asset had been slow/- fr past movement
range upside = 33%
I think, it's at support and on the way to test again 25/27c
All the best
Not a guru

IOTA SHORT SETUP Iota Price broke down from the ascending symmetrical triangle it was trading in, broke down the support Trendline and successfully retested for further downward continuation.
See all ideas
Summarizing what the indicators are suggesting.
Oscillators
Neutral
SellBuy
Strong sellStrong buy
Strong sellSellNeutralBuyStrong buy
Oscillators
Neutral
SellBuy
Strong sellStrong buy
Strong sellSellNeutralBuyStrong buy
Summary
Neutral
SellBuy
Strong sellStrong buy
Strong sellSellNeutralBuyStrong buy
Summary
Neutral
SellBuy
Strong sellStrong buy
Strong sellSellNeutralBuyStrong buy
Summary
Neutral
SellBuy
Strong sellStrong buy
Strong sellSellNeutralBuyStrong buy
Moving Averages
Neutral
SellBuy
Strong sellStrong buy
Strong sellSellNeutralBuyStrong buy
Moving Averages
Neutral
SellBuy
Strong sellStrong buy
Strong sellSellNeutralBuyStrong buy
Displays a symbol's price movements over previous years to identify recurring trends.
Curated watchlists where IOTAUSDT.P is featured.

Gen 2: Crypto is here to stay - and it's brought some friends…
19 No. of Symbols

Smart contracts: Make the smart decision
36 No. of Symbols
See all sparks