IOTA (MIOTA) Price Prediction Analysis IOTA (MIOTA) Price Prediction 2022
IOTA (MIOTA) holds the 64th position on CoinGecko right now. MIOTA price prediction 2022 is explained below with a daily time frame.
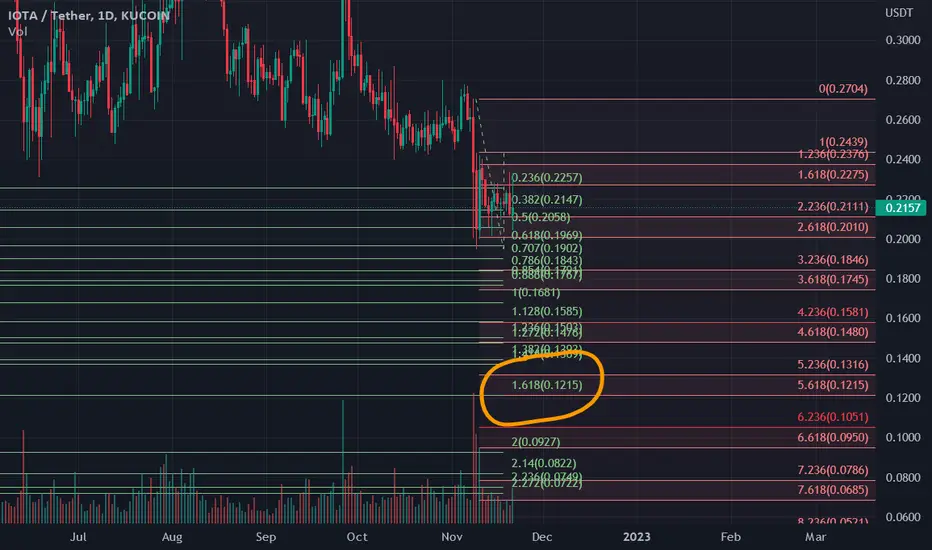
The falling wedge is a bullish pattern. Together with the rising wedge formation, these two create a powerful pattern that signals a change in the trend direction. The falling wedge pattern occurs when the asset’s price is moving in an overall bullish trend before the price action corrects lower. Within this pullback, two converging trendlines are drawn. One of the main features of the falling wedge pattern is the volume, which decreases as the channel converges.
Currently, IOTA (MIOTA) is at $0.2128. If the pattern continues, the price of MIOTA might reach the resistance level of $0.5758 If the trend reverses, then the price of MIOTA may fall to $0.1964
Happy Trading
IOTAUSDT.P trade ideas

IOTA / USDT Long TradeTrading the continuation of the pullback to the upside.
Targets are close to the recent high, 100% extension and 123% extensions (approximately).
Stop loss gives some room for another low in smaller timeframes.

IOTA/USDTIOTA/USDT
It has lost the support of 26 cents and a little stabilization in this area can drop up to 15 cents.

IOTAUSDT is creating the ascending channel below the resistance
The price is trying to hold the ascending channel below the daily resistance after the first rejection from the supply zone.
How to approach it?
IF the price is going to have a breakout and retest the resistance as new support, According to Plancton's strategy , we can set a nice order
–––––
Keep in mind.
🟣 Purple structure -> Monthly structure.
🔴 Red structure -> Weekly structure.
🔵 Blue structure -> Daily structure.
🟡 Yellow structure -> 4h structure.
⚫️ black structure -> <= 1h structure.
–––––
Follow the Shrimp 🦐

$IOTA Trendline Broken in 1D TFI think $IOTA is ready to move up since the trendline in 1D TF is confirmed to be broken, current support at $0.23 - $0.24 is expected to be revisited before the higher move up.

$IOTA has been at the support for the past few weeks$IOTA has been at the support for the past few weeks. Price will likely to move upside if there's rejection at current support at $0.23 - $0.25 region.

IOTA/USDTIOTA/USDT
In my opinion, this support of 25 cents is no longer worth launching and growing.
Did enough support.
I think it can drop to at least 14 cents.
#IOTAUSDT #IOTA #BTCUSDT #BTC #ETHUSDT #DOGE #DOGEUSDT

IOTA USDT LONG SWING | IOTAUSDT | LONG @ 0.25 - 0.26 | TP @ 0.262, 0.264, 0.266, 0.268, 0.27 | SL @ 0.24 | PATTERN = THREE WHITE SOLDIERS | BINANCE |
Swing trade idea. Kindly follow targets and stop loss. Will update with new targets once all 5 are achieved. Mostly trading with PNF charts, MACD, RSI, Stoch, BPI, Cipher, MA/EMA, Support/Resistance on hourly timeframes and higher time frames
BINANCE:IOTAUSDT BINANCE:IOTAUSDTPERP BINANCE:IOTAUSD BINANCE:IOTABUSD BYBIT:IOTAUSDT KUCOIN:IOTAUSDT

IOTAUSDT (4H) - Bearish breakoutHi Traders
IOTAUSDT (4H Timeframe)
The market is in a downtrend and we are waiting for an entry signal to go SHORT below the 0.2616 support level. Only the upward break of 0.2813 would cancel the bearish scenario.
Trade details
Entry: 0.2616
Stop loss: 0.2813
Take profit 1: 0.2495
Take profit 2: 0.2365
Score: 6
Strategy: Bearish breakout

iota long ideaBreak of market structure. Correction in a descending channel to previous 4 hr low. Im long here with stop below the .27. If we can close above .32 next looking at .35
NFA

MIOTA shortMIOTA broke trough the support level. Asset broke trough the ascending trendline. Bearish movement to support level at 0.245 is possible.

#IOTA/USDT - LONG - Hedged ScalpCheck out my parallel ideas for BTC and IOTA. We're running 3 scalps 2 longs and one short as a hedge.
#IOTA/USDT
LONG
LEVERAGE: 10-20X (Recommended)
ENTRY: 0.2915
TP1: 3.14%
0.3002
TP2: 6.17%
0.3095
SL: 1.51%
0.2871

IOTAUSDTHello Crypto Lovers,
Mars Signals team wishes you high profits.
This is a one-day-time frame analysis for IOTAUSDT
Here we have R2 as a resistance area which represents that the price was not able to rise at several points. R1 used to be a support area and S1 used to be another resistance line. Therefore, we have the price fluctuating bellow R1 area and we expect it to fall to S1 (as it used to do in its past behavior) and we should wait for some rising signs in order to have an increase for the price toward R2. In case the price is not supported at S1, more fall is there for it.
Warning: This is just a suggestion and we do not guarantee profits. We advise you to analyze the chart before opening any positions.
Wish you luck

#IOTA Stay above .30 we are longpossible targets are upto .4 based on fib level and S/R levels.
if fails to stay above daily level then its a no go.

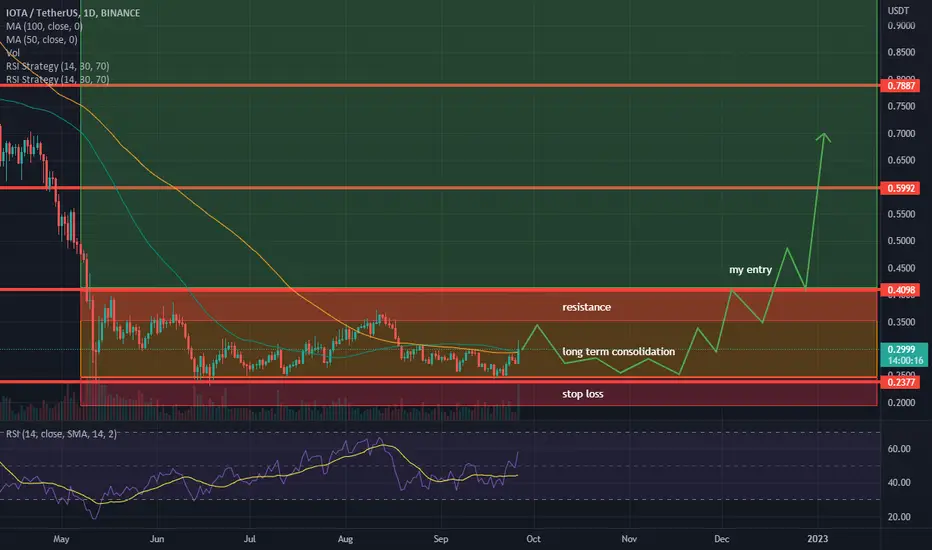
IOTA 1D Long TermWould recommend to buy only on confirmations with volumes. You can always buy while its consolidate but do you really want to freeze your money on such sheet*coins. My entry would be after resistance break out and retest or when I clearly see the uptrend and market interest.
IOTA CAN MAKE A CORRECTIONThe entry point is red box. I think that after seeing this range, this symbol will undergo a sharp correction

IOTAUSDT breakout with target 0.2670Look for the breakout 0.2740 BUY STOP MARKET entry and hold the long 0.2670

Ya herro ya merro v0.2As you see, we have a little hope. :P I'm waiting for the aliens to come when everything starts to work out.

Ya herro ya merroİşte burası tüm düşenlerin kesiştiği yer yani ya herro ya merro denilecek yer, buradan dönerse ya herro düşerse ya merro.

Hopium on $iotaWill pump? I think yes. Will dump more. I hope no. Here is deep? Chart will say 6 days later.

This time I see coincidences in that he sees a LongVoy a replicar el comportamiento, pero no voy a operar, sin más, es solo una repeteción pero con espectativas más realistas de profit

IOTAUSDT - 4h short signal💡💡#SIGNAL 💡💡
IOTA / USDT
▶️ Sell NOW + Line
🔴 SLT - 4h
#IOTAUSDT_4h_020922
