#IOTA/USDT falling wedge#IOTA/USDT falling wedge
According to the chart, the falling wedge or ending diagonal pattern is formed at the end of an upward trend, which promises the possibility of starting an upward movement. This upward movement can be both a long-term uptrend, and it can be a correction in the middle of a downtrend.
Based on this pattern and the placement of the price at the bottom of the channel, we can expect to see the price grow up to one of the following targets.
TP1: 0.19$
TP2: 0.27$
TP3: 0.35$
TP4: 0.55$
Price now: 0.1516
STOP LOSS: 0.1180
IOTAUSDT trade ideas

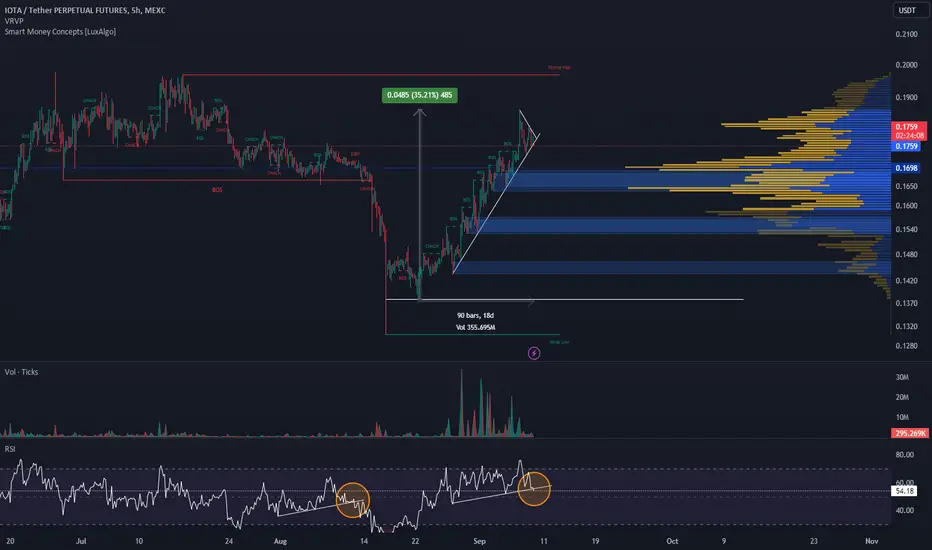
Bullish Head and Shoulders PatternFormation:
The Bullish Head and Shoulders pattern typically materializes after a downtrend. It consists of three key components: a left shoulder, a head, and a right shoulder. These components form peaks on a price chart.
Left Shoulder:
The left shoulder is the first peak and is often the result of a significant price decline. It marks the beginning of the reversal pattern. However, it does not always need to be a perfect peak and can exhibit some variability in size.
Head:
The head is the central and highest peak in the pattern. It represents a point of extreme selling pressure. The head is typically the lowest low in the pattern, indicating a strong downward push by bears.
Right Shoulder:
The right shoulder is the last peak before the trend reversal. It is usually lower than the head but higher than the left shoulder. It signifies diminishing selling pressure.
Breakout Confirmation:
The breakout occurs when the price of IOTA/USDT rises above the neckline, 0.1479 . This event signals a bullish trend reversal, and it's an entry point to go long on the asset.
Price Target:
To estimate the potential upside, measure the vertical distance from the head to the neckline. Then, add this measurement to the breakout point where the price moves above the neckline. This projected distance gives a rough target for the price movement.
Caution:
While the Bullish Head and Shoulders pattern is a reliable indicator, no pattern guarantees success. Traders should employ risk management strategies, set stop-loss orders, and consider other market factors before making trading decisions.

IOTAUSD ❕ declineIOTA has fixed under 200EMA (30m TF)
Indicators are still unable to form a pivot point.
I believe that the asset will continue to decline.

IOTA Long 🟢 7%, 12%, 24% in 3-5 daysI suppose, that we won't grab the lower liquidity, bitcoin is in flat right now, and will be till Friday. So IOTA want to grab top liquidity

Pullback IncomingIOTA is an open-source ledger technology and cryptocurrency tailored for the Internet of Things (IoT). Instead of a traditional blockchain, it employs a directed acyclic graph for its ledger, which could offer better scalability. Unlike systems that rely on miners, in IOTA, any node introducing a new transaction must validate two prior transactions. This mechanism eliminates transaction fees, making microtransactions viable. Currently, the IOTA network relies on a coordinator node managed by the IOTA Foundation for consensus. This central point makes the system centralized for now.
IOTAUSDT may drop 56 % IOTA has been in a downtrend for a long time.
It can't break the downsloping resistance and we believe that the key support may break on the next retest.
If it happens and we get a capitulation, then IOTA may drop even 56% and retest all time lows from 2020. It would be a great buying opporunity for a LONG TERM investment.
ETHBTC is bearish now which also confirms our bearish bias on IOTA:
Do you agree? Let us know in the comment section.

IOTA - Setting up Wave 5
IOTA is printing an impulsive wave since mid-August, and my primary count considers that we´re in the first sub-wave of green wave V.
A break of 0.1747 sets the first target at 0.1872 (wave III high).
Higher targets may be set after further price action.

IOTA SELLINGLooking at the daily time frame, we are beginning to see bearish moves. So it's time to sell. You can make some money selling on the futures section from this. Below are the entry and take profit points.
Stop loss: 0.1761
Entry: 0.1722 - 0.1675
Target 1: 0.1660
Target 2: 0.1595
Target 3: 0.1532
I usually advise to leave the market at take profit 2, don't be too greedy. Market presents a lot of endless opportunities. Also remember Bitcoin determines the market trend, so trade with caution. Show me support by liking and commenting on this post. I am also open to opinions of others.

All bets on IOTA Been in consolidation since eternity now. Looking forward for the breakout and its gonna be epic when it does break out.
I'm selling everything and going all in on iota. Trade safe and don't go rekt like me. also follow me if u like the ideas, helps a lot, thanks folks

Here is IoTA Buy TradeHere is My Study On IOTA
Welcome to my channel! Here you'll find daily technical analysis ofthe latest trends in the crypto market. From Bitcoin to altcoins, I'lIl be sharing my insights and predictions to help you make informed decisions
about your investments. Follow me for the latest updates and join the conversation in the comments!
Crypto technical analysis uses past price history to predict future price. It's not a guarantee and shouldn't be relied on solely for investment decisions. Consider other factors such as market trends, economic strength and
information dissemination. Use with caution.
This Is Not A Finacial Advise

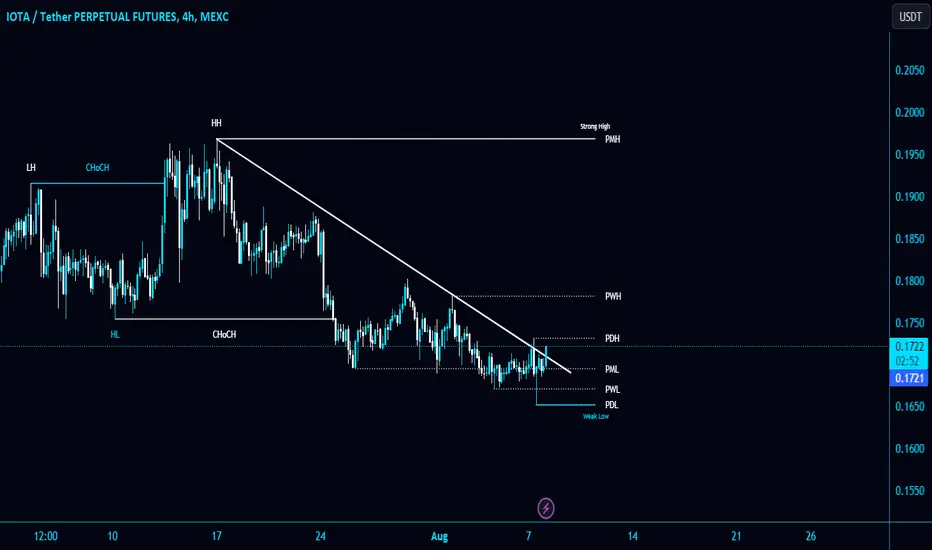
$IOTA$IOTA/USDT
On H4 timeframe level the price action is respecting its Horizontal Resistance level where marked out the Buy Side Liquidity
We can expect some rejection level from there

IOTAUSD ❕ ascending wedgeIOTA is moving in an ascending wedge.
Price, RSI chart and trading volume dynamics have formed a divergence (4H TF)
I believe that the asset will start correction after fixing under the resistance level.

Finally Iotas Preparing For Massive Bullish Rally Seems Like Has Already Bottomed Out And Getting Ready For Massive Bullish Rally In Midterm
Formed Falling Wedge In 2 Days Tf And trying To Break It Incase Of Successful breakout Expecting Massive Bullish Rally
Incase Of Breakout expecting Move Towards 0.60$

IOTA Spring-loaded for a 'Hook' Rebound: Bottom-Bounce 🚀IOTA Gears Up for a 'Hook' Move off the Bottom 🎣📈
IOTA/USDT 3-day Chart: Primed for Action 💥
--> Unlocking Potential = Breaking 16 Cents Resistance <--
A Strong Project, ISO 20022 Compliant 🌐 #Crypto #IOTA
IOTA is a unique cryptocurrency that employs a revolutionary technology called the Tangle, a directed acyclic graph (DAG), instead of a traditional blockchain. This enables feeless microtransactions and scalable network growth. IOTA aims to power the Internet of Things (IoT) by facilitating secure data and value transfers between machines. It stands out for its focus on scalability, security, and efficiency, making it a promising solution for IoT applications and beyond. IOTA's innovative approach has garnered attention from industries seeking to leverage its decentralized architecture for various real-world use cases.

The 0.1765-0.1968 section is the first diverging sectionHello?
Traders, welcome.
If you "Follow", you can always get new information quickly.
Please also click "Boost".
Have a good day.
-------------------------------------
(IOTAUSDT chart)
(1D chart)
Could the current be the last low point of this time?
This can only be known in the past.
Therefore, rather than worrying about such things, it is necessary to focus on determining the timing of short-term buying by checking whether there is support or resistance at any point or section.
In that sense, the 0.1765 point is an important support and resistance point.
Therefore, the key is whether the price can sustain the price increase above the 0.1765-0.1968 range.
To do so, it is important to be able to hold the price up until it rises above 0.1592 and the MS-Signal indicator turns into a bullish sign.
When this happens, it's time to start short-term trading.
Depending on whether this short-term trade rises above the 0.1765-0.1968 range or not, you need to decide whether to get a cash profit or leave the number of coins (tokens) corresponding to the profit to have the power to continue trading.
It takes a lot of time to turn into a full-fledged uptrend, so it's tedious and exhausting to keep increasing your holdings until then.
However, if you increase the number of coins (tokens) you have for profit, you will eventually be able to get a big profit.
Whether it's worth taking IOTA into mid- to long-term trading that way is up to you.
FYI, the current coin market is still far from the real world.
Therefore, the real world, that is, whether or not there is business value, should not be used to determine the value of a coin.
Whether or not the current coin is worth investing in is based on the number of users, that is, whether or not there is community power.
-----------------------------------------------
(IOTAKRW chart)
(1D chart)
It needs to rise above 329 to turn into an uptrend.
To do so, it needs to show a rise above 217 to hold the price.
Based on the current trend, whether it can rise above the 217-283 zone will determine whether a trend reversal will begin or whether the cascade will continue.
Therefore, in order to start trading IOTA, when it shows support around 217, I think it's when the MS-Signal indicator turns into a rising sign and shows support and rising.
-------------------------------------------------- -------------------------------------------
** All descriptions are for reference only and do not guarantee profit or loss in investment.
** The trading volume indicator is displayed as a candle body based on 10EMA.
Display method (in order of boldest)
More than 3x 10EMA trading volume > 2.5x > 2.0x > 1.25x > trading volume below 10EMA
** Even if you know other people's know-how, it takes a considerable period of time to make it your own.
** This is a chart created with my know-how.
---------------------------------

IOTAUSD ❕ support areaTrading volumes decreased on the price correction and the chart reached the support area.
The asset has fixed above the 50EMA (4H TF)
The 1H TF shows that the price chart and RSI are forming a convergence.
RSI is holding above 50 pips.
I believe that the asset will rise after fixing above the current area.


IOTA and the 1150 Risk To rewards potential Opportunity Hi Everyone;
today we have one of the best risk to reward Investment opportunity
it is more than 1150 times the risk and the chart is look very promising.
I expect breaking the previous bear market key point will clear the way to the final target

#IOTA/USDT breaking the Diagonal Trendline in 4-Hour TF!#IOTA/USDT breaking the Diagonal Trendline in 4-Hour TF!
Wait for PDH $0.1730 BO to open a Long/Short position.
IOTAUSDT Long/Short Just an IDEAIOTA is been in downtrend after getting good liquidity till ..168
A reversal with strong Support here is the scenario ...
expected a breakout and if it goes above .1874 n retest then it can be a good entry till .22
as it is in downtrend another scenario is ther,
it might get rejected at Daily n can land up checking .1588
so be patient n watch the Move...
A good Gain is expect at right entry ....
NAFA n DYOR
Thank You

IOTAUSDT ready for the breakout?The price of IOTAUSDT is currently trading within a descending channel pattern on the daily timeframe. A descending channel is characterized by two parallel trendlines, where the upper trendline acts as resistance and the lower trendline acts as support. This pattern often indicates a potential continuation of the downtrend.
You mentioned that there's a possibility for the price to grab new liquidity, which generally implies that the price might experience a move to attract more buying interest or selling pressure around a specific price level.
In your analysis, you are waiting for a breakout above the resistance level at $0.19. A breakout occurs when the price convincingly moves above a significant resistance level, potentially signaling a shift in market sentiment from bearish to bullish.
According to Plancton's Rules, a new long position is suggested if the price successfully breaks out above the $0.19 resistance level. A long position involves buying the asset with the expectation that its price will rise, aligning with the potential bullish momentum indicated by the breakout.
–––––
Follow the Shrimp 🦐
Keep in mind.
🟣 Purple structure -> Monthly structure.
🔴 Red structure -> Weekly structure.
🔵 Blue structure -> Daily structure.
🟡 Yellow structure -> 4h structure.
⚫️ Black structure -> <= 1h structure.
Follow the Shrimp 🦐

IOTA Main Targets for Bull RunBINANCE:IOTAUSDT
Iota main conservative targets for bull run
Possible Targets and explanation idea
➡️Yearly chart. Most negative scenario its a sweep liquidity March 2020 lover 0.0534$
➡️Based on my ADZ indicator we got huge weekly divergency - Bullish
➡️Trade inside 27 zone on weekly fib - accumulation stage/ bottom
➡️Have a chance to test 0.13 again or 0.10 before bounce but not an necessarily
➡️Take profit line now around 0 level 0.67 cents
➡️ Main middle term target is sweep liquidity at 0.76 lvl fib around 2.25
Hope you enjoyed the content I created, You can support with your likes and comments this idea so more people can watch!
✅Disclaimer: Please be aware of the risks involved in trading. This idea was made for educational purposes only not for financial Investment Purposes.
---
• Look at my ideas about interesting altcoins in the related section down below ↓
• For more ideas please hit "Like" and "Follow"!

IOTAHello Traders,
IOTA had broken the resistance now it is re-testing above the resistance we can expect a bullish move from here in IOTA
