#IOTA/USDT#IOTA
The price is moving within a descending channel pattern on the 12-hour frame, which is a retracement pattern
We have a bounce from a green support area at 0.2000
We have a tendency to stabilize above the Moving Average 100
We have an upward trend on the RSI indicator that supports the rise and gives greater momentum
Entry price is 0.2100
The first target is 0.2471
The second target is 0.2700
The third goal is 0.2990
IOTAUSDT trade ideas

#IOTA/USDT /Ready to go up#IOTA
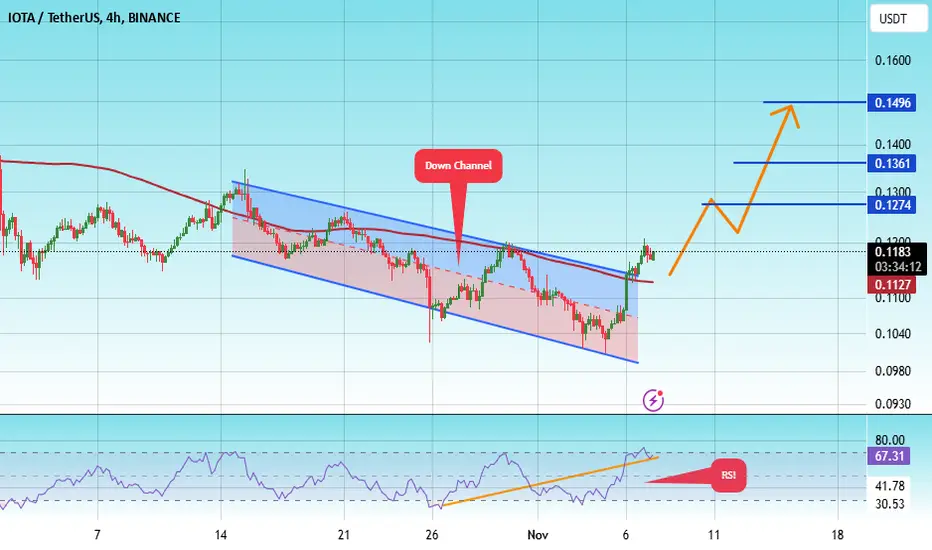
The price is moving in a descending channel on the 4-hour frame and sticking to it well
We have a bounce from the lower limit of the descending channel, this support is at 0.1011
We have an upward trend, the RSI indicator is about to break, which supports the rise
We have a trend to stabilize above the moving average 100
Entry price 0.1182
First target 0.1274
Second target 0.1360
Third target 0.1496
IOTA superbIota looking super bullish after our Fbuy print. A good volume is already generated.
Expecting next stop at 0.42 area.
DYOR
For indicator access drop a message.

SPOT IOTA LONG 30.11.2024🎯Purpose:
0.3401
‼️We enter at 0.5% of the allocated money for spot trading.

IOTAUSDT Long Setup Setting / Am I going to let you lose?BINANCE:IOTAUSDT
CRYPTO:IOTAUSD
📈Which side you pick?
Bull or Bear
SL1 ---> Low-risk status: 3x-4x Leverage
SL2 ---> Mid-risk status: 5x-8x Leverage
(If there is just one SL on the chart, I suggest, low risk status)
👾Note: The setup is active but expect the uncertain phase as well. also movement lines drawn to predict future price reactions are relative and approximate.
➡️Entry Area:
Yellow zone
⚡️TP:
0.2189 (Close it if you don't want to lose any)
0.2282
🔴SL:
0.2030
🧐The Alternate scenario:
If the price stabilizes against the direction of the position, below or above the trigger zone, the setup will be canceled.

IOTAUSDT Elliott Waves (Local Setup)Hello friends.
Please support my work by clicking the LIKE button👍(If you liked). Also i will appreciate for ur activity.
Everything on the chart.
Entry zone: market and lower
Targets: 0.15 and 0.18
after first target reached move ur stop to breakeven
Stop: 0.0046 (depending of ur risk).
ALWAYS follow ur RM
risk is justified
It's not financial advice.
DYOR!

IOTA Upside ReversalPrice broke the descending trendline with an impulsive wave. Everything is favorable for a continued upside.
Ideally, I'd like to see a test of the 50-61.8% pullback zone, testing the gray trendline as support.

IOTAUSDTIOTA ~ 1W
#IOTA this is the lowest support block on this coin. Buy in stages with a minimum target of 20%++. Don't miss this lowest price.

IOTAUSDTFWB:IOTA ~ 1W
#IOTA If you have Conviction on this coin,. This support block would be a very good buy for now.

IOTAUSDT.P shortAs of the moment, the direction of this market is sideways. Waiting for the token to touch the zone before making some decisions. However, this is my initial plan for this trade. Got my resistance and support for my TP area. will look for a confirmation candle before marking my SL.

IOTAUSDTIOTA ~ 1W
#IOTA If you have Conviction on this coin,. This support block would be a very good buy for now.

IOTAUSDTIOTA ~ 1W
#IOTA If you have Conviction on this coin,. This support block would be a very good buy for now.

IOTA is bullishFrom where we put the red arrow on the chart, it seems that the correction of IOTA has started.
This correction seems to be a double (zigzag + triangle) that is now over and the trigger line is broken.
By maintaining the green range, it can move towards the targets.
Closing a daily candle below the invalidation level will violate the analysis
For risk management, please don't forget stop loss and capital management
When we reach the first target, save some profit and then change the stop to entry
Comment if you have any questions
Thank You

Good time to buy IOTAIOTA (IOTA) is one of the first coins which I started to follow and invest in. This is trade (investment) setup on larger timeframe. I am not looking to reach targets 2,3,4 and 5 very soon, that could be year(s). I will sell most of my capital on targets 3 and 4. Small portion will be sold on Target 1 and 2.
Entry Zone: 0.2599 – 0.3174
Buy Zone 1: 0.1057 – 0.1624
Target 1: 0.8783 – 0.9707 (177%)
Target 2: 1.3817 – 1.4556 (335%)
Target 3: 1.77 – 1.81 (468%)
Target 4: 2.29 – 2.39 (631%)

$IOTA Long ContinuesIOTA reacts nicely to 4 hour hold levels.
If you are in a long TP 1 should be 0,1397.
Given that markets start to feel fresher i'd let 50% run to catch further upsied

$IOTA/USDTP 4h Buy opportuniuty on Holdlevel supportFWB:IOTA hitting into a restance Zone here. We have a newly formed 4h support hold level.
Expecting a retract and an opportunity to long again at the 0.1313 area for a further continuation to the upside

$IOTA/USDTP 4h longNice chance if we reclaim the upward trend and close above 0.1307.
Long setup towards the next holdlevel at 0.1344-0.1351.
Recomend to close 75% in this range as it likley not gonna break that resistance at the first attempt

Long position on IOTAUSDT 30Min/ Volume PredictionBINANCE:IOTAUSDT
BITFINEX:IOTUSD
Mid-risk status: 3xLeverage
Low-risk status: 2x Leverage
⚡️TP:
0.1658
0.1665
0.1680
0.1690
0.1700
0.1710
0.1745
0.1757(In Optimistic Scenario)
➡️SL:
0.16
0.1565
The Alternate scenario:
If the price stabilize below the trigger zone, the setup will be cancelled.

IOTA LONGIota currency has made a good return and is on support. Now, if it exits this triangle with strength, it can form a higher ceiling until autumn BINANCE:IOTAUSDT KUCOIN:IOTAUSDT

IOTAUSDT 1WIOTA ~ 1W
#IOTA Very interesting support block to start accumulation. at least for a minimum 20%+ increase from here.

#IOTA Technical Analysis in Weekly TimeframeHello everyone, I’m Cryptorphic.
For the past seven years, I’ve been sharing insightful charts and analysis.
Follow me for:
~ Unbiased analyses on trending altcoins.
~ Identifying altcoins with 10x-50x potential.
~ Futures trade setups.
~ Daily updates on Bitcoin and Ethereum.
~ High time frame (HTF) market bottom and top calls.
~ Short-term market movements.
~ Charts supported by critical fundamentals.
Now, let’s dive into this chart analysis:
IOTA is under a descending triangle pattern, and the CMP is at the supporting trendline of $0.1448. This support level is crucial for IOTA to hold. A breakdown and close below this level will likely continue the bearish pattern.
On a positive note, if IOTA sustains the current support level, we will likely see a rebound, testing to break the resistance trendline at around $0.26.
Key Observations:
~ Crucial Support: $0.14.
~ Resistance: $0.26.
~ Rebound Invalidation Point: Weekly breakdown and close below the current support level.
DYOR, NFA.
Please hit the like button to support my content and share your thoughts in the comment section. Feel free to request any chart analysis you’d like to see!
Thank you!
#PEACE

IOTA poised for a BIG move4 years resistance and support encounter are near. Honestly, crypto will only evolve when Bitcoin lose its throne. Maybe it is a good time for altcoins outside the top 10. Primary target is $0.61, second target $0.9~$1.

IOTAUSDTHM signal v5.0 (High momentum) spotted. Looking good with previous wave up with increasing volume and momentum.
- Heathy retracement and support well at good level @ 0.1755-0.1765
- Trending slow and steady if able to hold above the support zone
It is at extremely good reward to risk level now if able to hold above the support level.
