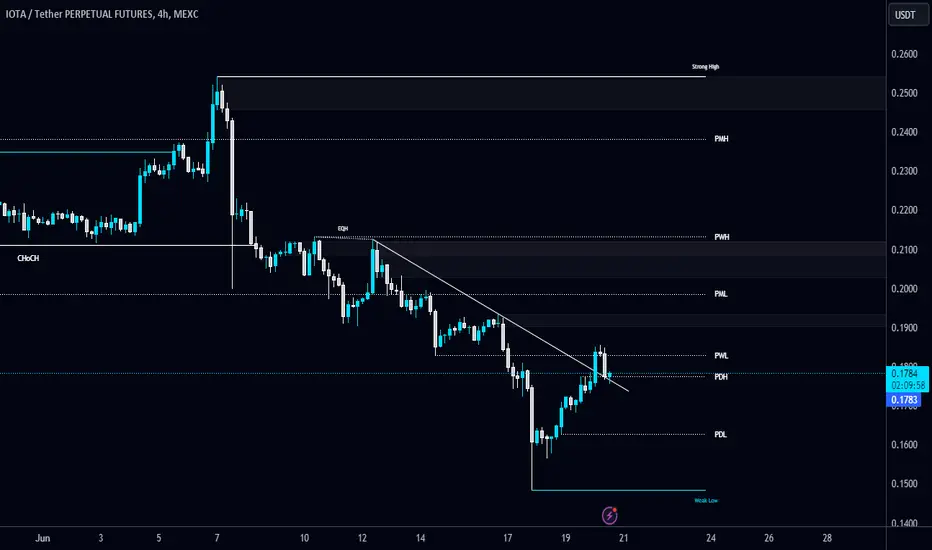
#IOTA/USDT breaks the Diagonal Trendline in 4-Hour TF!#IOTA/USDT breaks the Diagonal Trendline in 4-Hour TF!
FWB:IOTA is bullish as long as it holds this Trendline as a support. The local resistance level is PWL $0.183, and the support level is $0.163.
IOTAUSDT trade ideas
Alikze »» IOTA |Pullback to dynamic trigger is brokenAccording to the previous analysis , he was able to touch the first supply area of the 0.43 range with the flag pattern.
💎 But now in the 4H time, after exiting the density and breaking the dynamic trigger, it can now touch the specified areas and also the first supply area with the support of the green box area.
💎 Alternative scenario: if the green box is broken, the correction can be extended up to the Fibo range of 1.272.
🟩Sup: 0.2075 ~ 0.2136
⛳️Tp 1:0.2320
⛳️ Tp2 : 0.2441
⛳️ Tp3 : Red Box
»»»«««»»»«««»»»«««
Please support this idea with a LIKE and COMMENT if you find it useful and Click "Follow" on our profile if you'd like these trade ideas delivered straight to your email in the future.
Thanks for your continued support.
Sincerely.❤️
»»»«««»»»«««»»»«««

IOTA USDT LONGAnother cryptocurrency that I have in my portfolio and has the potential to grow 10x is Utah. It had a very good growth in the last season, this time it is possible to get a good profit because it is a low risk place
My good friend, thank you for accompanying me, I hope you will be profitable
ASLAN_FOREX_US

IOTAUSDT 1D#IOTA has broken the falling wedge pattern to the upside on the daily chart. It has also broken the MA50, which is a bullish sign. Targets are:
$0.2779
$0.3050
$0.3321
$0.3708
$0.4200

Iota/Usdt On The Verge Of BreakoutIota/USDT appears to be exhibiting strength in the short term. All that is required now is to wait for a breakout of this pattern. In the event of a successful breakout, a 15-30% bullish move can be anticipated. It is important to note that this is not financial advice; please conduct your own research (DYOR).

IOTAUSD 1WIOTA ~ 1W
#IOTA Make purchases gradually on this support block, with a minimum target of 20%+

iota usdt iota usdt target 0.28 minimum target
breaking out
morning star pattern in dially
3 white soldier in 4 hour
overaccumilation

IOTAUSDT - harmonic pattern on 1D time framehello traders,
We just published ICXUSDT analysis:
Now let's have a look at IOTA.
IOTA looks similar to ICX in terms of technicals. We're expecting a similar outcome for IOTAUSDT pair.
Tripple bottom is confirmed and it's still early to buy on the spot now.
Target: 0,39$

📈IOTA Analysis: Short and Long Opportunities in Focus💥🔍Following Bitcoin's recent uptick last night, the concurrent increase in Bitcoin dominance prevented most altcoins from experiencing significant price gains. Instead, many coins traded within a range, with some even witnessing a decrease in value, such as IOTA, which we'll analyze today.
📚While I haven't conducted an in-depth study on the IOTA project yet, it generally operates as a protocol for feeless and permissionless data transfer, actively functioning in this domain. I'll provide more insights into this project once I've conducted thorough research. For now, let's delve into the chart to identify potential entry points.
📈On the 4-hour timeframe, which serves as my primary analysis timeframe for futures, the downward trend is evident, indicating a bearish trajectory. Therefore, with a suitable trigger, we can consider opening short positions. However, initiating long positions on short-term shorts requires higher risk tolerance due to the market's direction.
✨Currently, we are within a support range from 0.2020 to 0.2086, and the price is consolidating within this range to determine whether buyers can maintain this support or if selling pressure will overwhelm them, causing the support to fail. Hence, we need to observe the upcoming developments. If the support breaks, we can expect a target of 0.1719, but if it holds, it may act as a bounce back to the SMA99.
📉For short positions, exert effort to open positions upon the breakdown of 0.2020 and the confirmation of a candle below this level, as this scenario could easily drive the price to 0.1719, offering a favorable risk-to-reward ratio. However, if you're considering long positions, patience is required until the price surpasses the SMA99, followed by identifying a trigger from the candles. The nearest trigger is at 0.2328, but as we're against the trend, consider securing profits at a risk-to-reward ratio of 2 or 3 and leaving some room for a target of 0.2599.
📊Currently, the candle volumes do not provide sufficient data due to recent holidays, with low volumes followed by a sudden increase. Therefore, we need to wait for a few more candles to compare volumes effectively. RSI triggers for long positions cannot be specified due to the timeframe limitation, as price movement towards the range high can significantly alter the RSI structure, rendering the triggers meaningless. However, for short positions, you can consider the breakdown of 27.22 as confirmation.
📝In conclusion, the analysis of IOTA presents both short and long trading opportunities, contingent upon market dynamics and price movements. While the current downtrend suggests potential short positions, traders should exercise caution and wait for confirmatory triggers, particularly a breakdown below the support range of 0.2020 to 0.2086. Conversely, for long positions, patience is advised until the price surpasses the SMA99, followed by identifying suitable triggers. It's essential to maintain a disciplined approach, considering risk management strategies and closely monitoring candle volumes for a comprehensive assessment of market sentiment. As always, adaptability and readiness to adjust trading strategies in response to evolving market conditions remain paramount for successful trading endeavors.
🧠💼It's important to acknowledge the inherent risks in futures trading, with the potential for margin calls if risk management is neglected. Always adhere to strict capital management principles and utilize stop-loss orders, ensuring that the initial target offers a risk-to-reward ratio of 2

IOTA/USDT BREAKOUT! READY FOR A PUMP🚀In the 4-hour time frame, IOST has broken out of this falling wedge pattern and is currently bouncing after retesting this pattern. If we look at it on a higher time frame like daily, we can see bullish divergences in the RSI. This seems like a solid choice. Its strong tokenomics and competent team make it a promising asset. The chart indicates the potential for significant growth in the next few weeks.
Entry: Current Market Price (CMP) and add more up to $0.22
Target: According to the pattern, we can expect up to a 50% to 70% bounce in the price.
Remember to do your own research.
NFA
#Crypto FWB:IOTA

IOTA USDTIOTA Setup. After a confirmed breakout from the marked zone in green, we could take an entry at 0.2300. Remember stop loss is your friend. Everything is on the chart.
Entry 0.2300
S.L 0.2155
T.P 1 0.2400
T.P 2 0.2522
T.P 3 0.2660

IOTAUSDT Elliott Waves AnalysisHello friends.
Please support my work by clicking the LIKE button👍(If you liked). Also i will appreciate for ur activity.
Everything on the chart.
Entry: Market and lower
Targets: 0.5 - 0.75 - 1.1 - 1.7
after first target reached move ur stop to breakeven
Stop: under 0.14 (depending of ur risk). ALWAYS follow ur RM .
RR: 1 to 15
risk is justified
It's not financial advice.
DYOR!

IOTA is backHi, we are longterm IOTA traders, Investors and do believe that IOTA is back on the radar - the current structure looks realistic mid-term. 2021 ATH in the next 12-18 months (imo) - cant predict the future but this looks very bullish

IOTA next targetsAfter we broke the downward channel, I expect fuel to lit the pump. Next targets are 0.618 fib ($0.39), 1 fib ($0.48) and 1.618 fib ($0.63). I'm a big fan of IOTA as a crypto technology, so I abstain from commenting news or development.

I Outta (from) here: IOTA overviewDo u know what meanz IOTA? Some token? NO OFCOURCE! :)
I
OBeY
Technical
A? NA? well u git it :)
And for being so smart, I present u my brilliant IDEA, u may applause if u like
time will judge but I foreseen wave 5 endin'.

IOTA/USDT In the crucial support area, it requires to bounce!💎 IOTA has indeed showcased notable market dynamics recently. It's currently bouncing from a support area, suggesting a potential upward movement to test the supply area.
💎 If it successfully breaks through the supply area, it could pave the way for a return to the strong resistance zone.
💎 However, if IOTA fails to hold the support area and breaks down, it could indicate a bearish momentum.
💎 In such a scenario, the price may continue its downward trajectory, potentially reaching lower levels.
MyCryptoParadise
iFeel the success🌴

Looking SHORT for $IOTATrendline breakout
Forming LH and LL
If the price reaches the specified area and gives a good reaction, it can be suitable for a sell position

IOTA/USDTLooks like the correction is done. Broke resistance and came back to clear out the unmitigated area. Im loaded long

Beauty of Characteristic feature of Emas & Smas1. Ema 100 crossing up sma 100
2. Ema 200 crossing up sma 200
3. Ema 365 crossing up sma 365
4. Then, ema100 & sma100 crossed above ema sma365 with a pullback & bounce, during this candles fall below ichimoku green cloud
5. Now, ema 200 & sma200 crossing above ema sma365, pullback is starting & the bounce will occur, candles are coming below Green Cloud,
6. Since the lower MAs cutting & raising above the higher MAs, & the bullish cycle is live..... after this halving, every crypto should/must move higher
7. The bullish momentum resumes

IOTA/USDT It need to bounce on the demand for back to upward!💎 IOTA has recently experienced significant market dynamics, potentially leading it back to the demand zone for a retest after facing a strong rejection from the key resistance area.
💎 If IOTA manages to bounce convincingly from the demand zone, it could signal a resurgence in bullish momentum. This bounce might pave the way for another attempt to break above the key resistance area.
💎 A successful breakout above this level would confirm a bullish trend for IOTA and could facilitate a move towards our target area.
💎 However, if IOTA fails to find support at the demand zone and continues to decline, the next significant level to watch is the support area. In this scenario, IOTA must bounce from the support area and reclaim the price above the demand zone to sustain any upward momentum.
💎 Should IOTA fail to bounce from the support area and instead break below it, it could indicate further downside potential for the price, with the possibility of continued downward movement.

Iota what is this?well guys, what is Iota.. im noy sure yet but i saw news about one universoty that will be use Iota, so i searched more and more. and i found this chart.
ehat i see in the chart is a cup and handle pattern.
i will wait for the brake.
yesterday i sold Limewire i had a 9x
not totaly sure if i made the good choise but even if it goes higgher i had my 9x

IOTA About To Breakout The Long Term Trend,Extreme Bullish Setup📈 The Price Is Playing Below The Long Term Trend Line And Its a Most Important Resistance For IOTA ,Breakout From This Resistance Is a Next Move I Expect By The Strong Green Candle ,Midterm Target Is 1.7$ ,Totally I’m Bullish About IOTA

Alikze → #IOTA | Forming a bullish flag patternIn the daily time, a flag can be seen in the medium-term ascending channel. Meanwhile, the current bullish log has also formed a flag that should probably break this resistance range. The corrective structure is a three-wave that has returned 1.272 waves and now it is highly likely that a new floor should not be built. Therefore, the created floor is valid for the specified targets.
🟩Sup: 0.19 ~ 0.1963
⛳️Tp 1:0.293
⛳️ Tp2 : 0.39
⛳️ Tp2 : 0.44
-----------------
Please support this idea with a LIKE and COMMENT if you find it useful and Click "Follow" on our profile if you'd like these trade ideas delivered straight to your email in the future.
Thanks for your continued support.
Sincerely.❤️
