IOTBTC trade ideas
Decay coinsSome speculative theory regarding the decaying nature of major altcoins, It can be seen that in the outer 1.618 fib ring in the ealy days of IOTA decay was present before lift off. Is this happening on a larger scale? Two pumps to .5 fibonacci retracement level support this theory that the next fib transition will produce a bullish outcome.

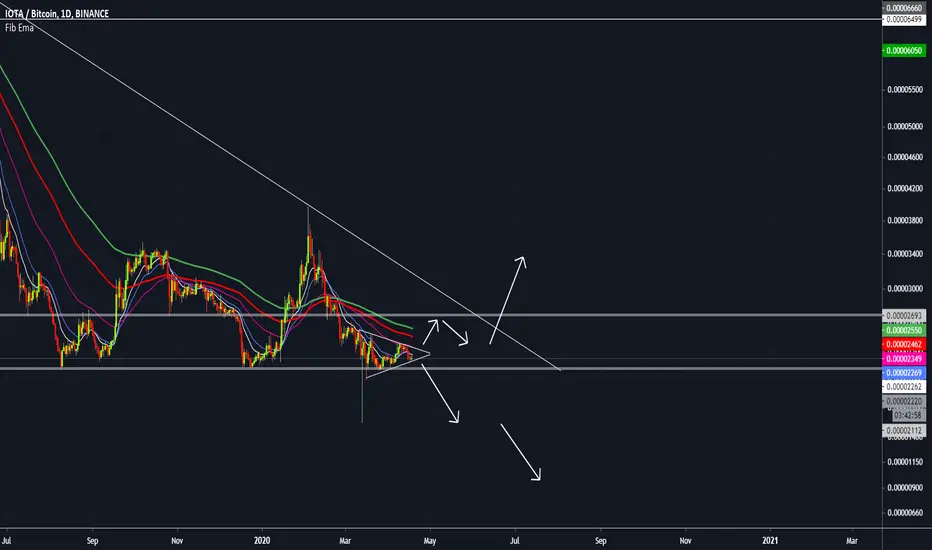
iOTA/BTC - intention to break intention to break the level of 0.00002387 on the daily typhoon
candlestick analysis shows a great pin bar to buy.
There may be one more rollback from the level, and only after the breakdown.
It will be more reliable to buy after the break-down and fixation.
Dear followers, the best "Thank you" will be your likes and comments!

Why I IOTA Long this breakWith BTC doing performing a bit of a consolidation at the moment, a few of the alts are taking the opportunity to bust a decent. Notable trades that I should have published include LINK, which I've fully closed out of, an BAT which I'm now 50% out of and stop loss is in profit.
IOTA pushed up through all 3 EMA's on the 4Hr chart, retesting each level before pushing upwards. Now it sits atop the slow EMA which has already held as support. I took an entry at the break of the medium EMA and this test of the slow EMA has me looking on the Daily chart for my 50% and final exits against the Daily EMA's.
Entering here I'd be setting my stop loss under the slow EMA and below previous structure. risk/reward looks good enough for my strategy to take this trade and see how it plays out.


IOTO/BTC long opportunity MBA TA fridayswatching price for two potential trades.
1. price is consolidating on strong daily support. Looking for price to break and retest resistance (2270) for a long entry. Stoploss below previous structure will access once placing the trade. Take 50% profit just below demand zone, watch price here to see if volume is picking up and trend looks strong, if so let the rest ride with stoploss moved into entry or profit.
2. Buy the bottom of the channel (2100) in antcipation of it breaking to the upside. take 25 % profit at top of consolidation area and watch if price is creating HH HL. If we break to the upside similar strategy to what was mentioned above. 50% at demand let the rest ride zone.
Expecting trade to last about a week.

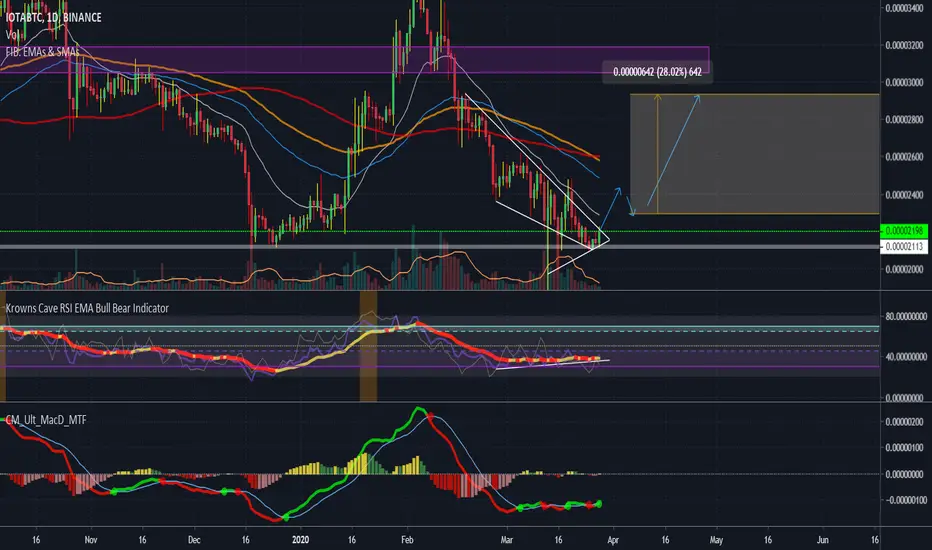
IOTA/BTC 1D (Binance) Wedge break-out and on channel supportMiota is sitting on the same old accumulation support, PA & RSI just broke-out a falling wedge (rose ones).
I'm expecting a small pull-back to give us a good entry, but you can enter now if you prefer.
This set-up is for short-term, but mid-term could be huge if it manages to close above big wedge resistance (beige one):
Buy Entry= 0.00002202 - 0.00002150
Take Profit= 0.00002365 | 0.00002547 | 0.00002889
Stop Loss= 0.00001987
Risk/Reward= 1:1 | 1:1.96 | 1:3.77
Expected Profit= 8.69% | 17.05% | 32.77%
Possible Loss= -8.69%
Fib. Retracement= 0.236 | 0.382 | 0.618
Margin Leverage= 1x | 3x | 5x


IOTA/BTC short term downtrend line brokenHello traders,
Here is a simple and quicly analyses for IOTA/BTC witch seems to be broken the short term resistance line after reversion on important support level.
PLease push like button and follow us on trading view.


Has IOTA bottomed?Potential rebound. Why?
- Closed above support
- MACD crossover
- RSI divergence
- Triangle & desc. wedge pattern
Wouldn't enter a long unless some MA's cross but has potential if:
- Close above 21 day ema
- Volume increases
- RSI closes above 50


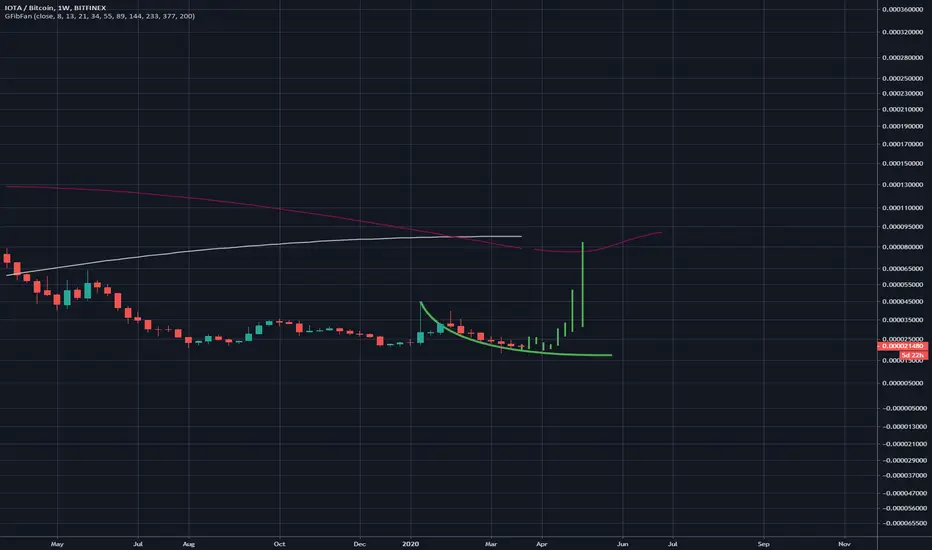
IOTA descending scallopIOTA has formed a descending scallop this is a bullish reversal pattern, weekly chart. Random fractal for PT at grey MA line, could go much higher although..
IOTABTC
Today I looked at the IOTA project!
Looks interesting, holding on to the low low support which we have two options either looking at the next low IOTY or strong support lasts and make big profits!
STOP LOSS:
1600 sat
TARGETS:
4200 sat
6200 sat
GOOD LUCK !

IOTABTC | Skyrocket is ready for a tripAt 2H timeframe we see a low risk and high potential entry for IOTABTC position.
There is a channels breakout intersection with a very strong bullish signals according to RSI bands and Stoch Relative strength oversold status. Volatility increases while momentum grows which indicates the beginning of a sharp uptrend.
In case it happens we will have a completed Inverse Head and Shoulders pattern on a macro downtrend which will act like a trend shit pivot point
Premium signals is already in the channel

IOTA Getting Ready To Move📡 #IOTA / BTC
🌐 Exchange : #BINANCE
▶️ Buy : 2290
👇 Targets :
✅ Tp 1 : 2500 (10%)
✅ Tp 2 : 2700 (19%)
✅ Tp 3 : 2900 (28%)
🔴 Stop loss Zone : 2100 ~ 2050


IOTA/BTC trading updateHello trader,
This is an update of our analyses on IOTA/BTC, we see the green box as a buying area, now the price just reverted on important support level and is showing us a bullish momentum, our objective is the next important Resistance.
Please, push like button and follow us on tradingview.


IOTA/BTC TA Update (potential 40% bounce?)IOTA/BTC
IOTA is back from the previous swing low at 2200 sats area and currently forming a bullish descending channel.
IOTA must hold this support zone in the coming few days because if it does,
we will have higher chances of breaking to the upside provided the market also cool-down from uncertainty.

IOTA - Capitulation or Dead Cat Bounce?Upon the collapse of BTCUSD from $8000 all the way down to $3.5k, IOTABTC almost broke its critical daily support at 0.00002100 BTC but managed to bounce back forming a V-shape capitulation bounce on the 1h timeframe. This strong V-shape bounce on the 1h timeframe is bullish in the way that it managed to close the 1D candle above the daily support showing us that there are indeed buyers here despite the fear.
TD 9 is also formed on the 1D as well as the 3D chart indicating a buy signal here. Whether IOTABTC and other alts will go up in the future really depends on BTCUSD at the moment, but as of now, I think this is a great spot to buy offering a great risk to reward ratio.

Don't miss the great buy opportunity in IOTABTCTrading suggestion:
. There is a possibility of temporary retracement to suggested support line (0.000021). if so, traders can set orders based on Price Action and expect to reach short-term targets.
Technical analysis:
. IOTABTC is in a range bound and the beginning of uptrend is expected.
. While the RSI resistance #1 at 53 is not broken, the probability of price increase would be too low.
. The price is below the 21-Day WEMA which acts as a dynamic resistance.
. The RSI is at 37.
Take Profits:
TP1= @ 0.0000262
TP2= @ 0.0000310
TP3= @ 0.0000400
SL= Break below S2
