IOTUSD trade ideas


One more wave up?
Prices have increased sharply
However, since there are no signs of reversal, we should expect one more wave up
Follow me for more update Guys!

Bulls just took control over MIOTADark blue line climbed above light blue line confirming the Bulls control...
Mid term it'll go up.

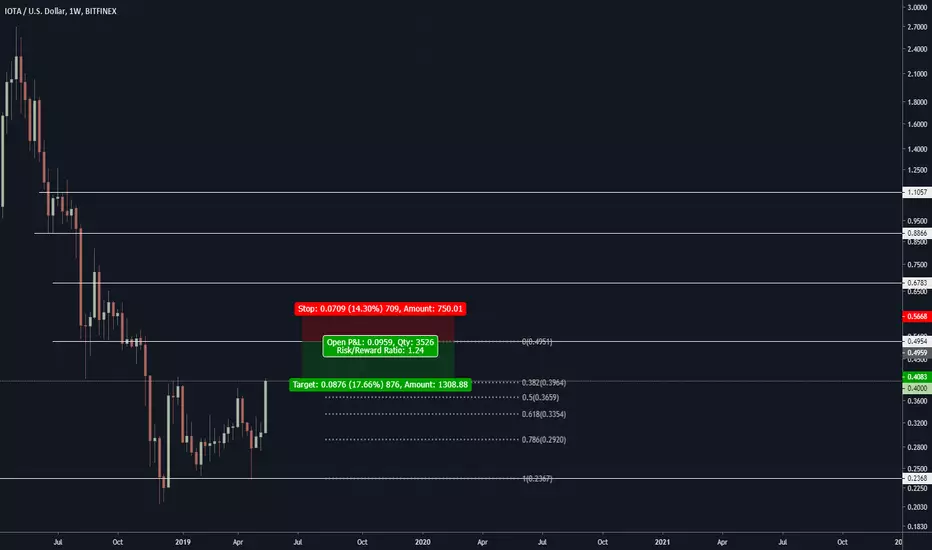
IOTA BULLSThis chart is being posted a week late but entries should have been placed on the retest down to $0.36 after it broke above the head and shoulders. The first target take profit is at the B point of the bullish bat pattern indicated on the chart which falls around $1.00.

IOTA is ready to make about 90% profit move up!Price forming bullish setup:
Golden Cross
Hidden Bullish Divergence
Breakout from Bullish Flag
1st Target 0.54$
2nd Target 0.78$

IOTA Price Analysis IOTA / USD: Pulling The TriggerIOTA / USD Short-term price analysis
IOTA has a bullish short-term trading bias, with the cryptocurrency advancing to a fresh 2019 trading high.
The four-hour time frame is showing an inverted head and shoulders pattern has now been triggered, with the IOTA / USD pair continuing its bullish move after testing neckline support.
Technical indicators are rising on the four-hour time frame and continuing to issue a strong bullish signal.
Pattern Watch
Traders should note that the inverted head and shoulders pattern on the four-hour time frame has yet to reach its full upside target.
Relative Strength Index
The RSI indicator on the four-hour time frame is bullish, although it is now trading in overbought conditions.
MACD Indicator
The MACD indicator on the four-hour time frame has turned bullish and continues to issue a strong buy signal.
Fundamental Analysis
IOTA has gained bullish momentum after the announcement of the Coordicide. The solution will remove the network’s centralized coordinator, and help achieve a greater level of decentralization.
IOTA / USD Medium-term price analysis
IOTA has a bullish medium-term trading outlook, with the cryptocurrency continuing to make strong gains since moving above its 200-day moving average.
The daily time frame is showing that a major bullish breakout has occurred from a sideways price channel that has been in place since the start of 2019.
Technical indicators on the daily time frame are bullish, although they are starting to appear overstretched.
IOTA / USD Daily Chart by TradingView
Pattern Watch
Traders should note that the September 22nd, 2018 swing-high is the overall upside target of the recent channel breakout on the daily time frame.
Relative Strength Index
The RSI indicator is bullish on the daily time frame and continues to highlight growing upside momentum over the medium-term.
MACD Indicator
The MACD indicator on the daily time frame is bullish, although it is starting to appear overstretched.
Fundamental Analysis
The announced Coordicide release could generate additional interest in the project. However, despite the project’s developments and partnerships, adoption still remains its main concern. Therefore, IOTA’s medium-term prospects will depend on its ability to find partners that will drive the adoption of its platform.
Conclusion
Further upside in the cryptocurrency is still expected over both time frames, with the bullish pattern on the four-hour time frame yet to reach its upside target.
Overall, the recent bullish channel breakout on the daily time frame has changed the technical picture for the IOTA / USD pair over the medium-term, with the balance of risk now firmly tilted to the upside.

Miota Bullish ChartHere my followers can monitoring this trade.
#playsafewithrado and with #stoploss


Iota back at crucial resistance. #IOTUSDThere was no resistance on the way down so maybe we’ll see no resistance on the way back up.


IOTA (MORE UP)another potential up move on iota (there's a possibility to make a new low if the last up move was a complete C wave )


IOT/USD, buy breakout.Buy break out of key level $0.43
1st Goal $0.4650
2nd Goal: $0.50
- The main trend is bullish
- Mostly price continue the trend movement

Iota Ascending Triangle. $0.5 soon? #IOTAUSDIota is at the top of an ascending triangle ready to break upwards.


IOTA will breakoutBuy entry: Before 0.43
Stop: 0.38
Target: 0.60
Take your profit and buy me a beer :D

IOTA following the foot steps of EthereumIf the price can breakout of its overhead resistance, a measured move would target $0.65

IOTUSD breaking 18 month downtrendIOTA is poking the line right now... if this continues upwards, it should be a big move. Good luck!


Iota Bullish Symmetrical Triangle. #IOTAUSDA bullish symmetrical triangle pattern has formed. The probability of this pattern being correct is increased by the coiling pattern in volume.
