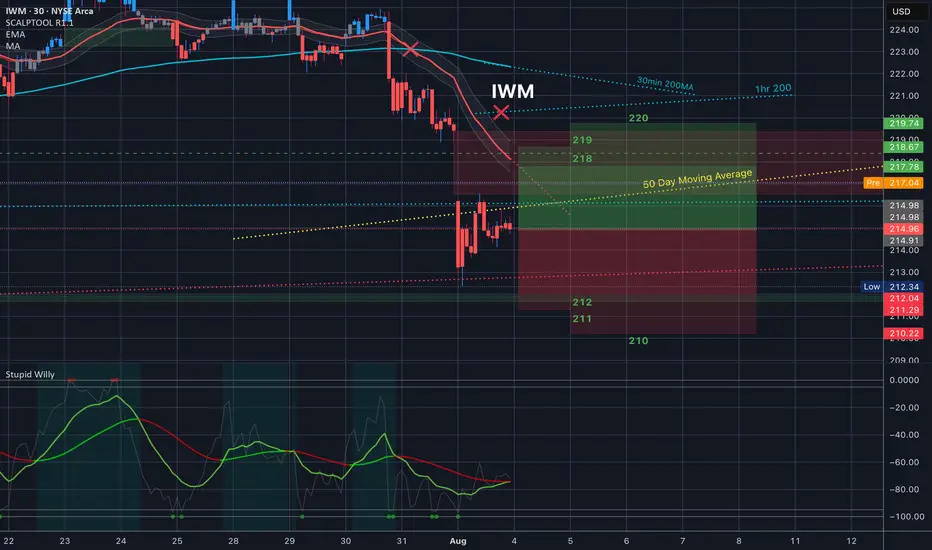
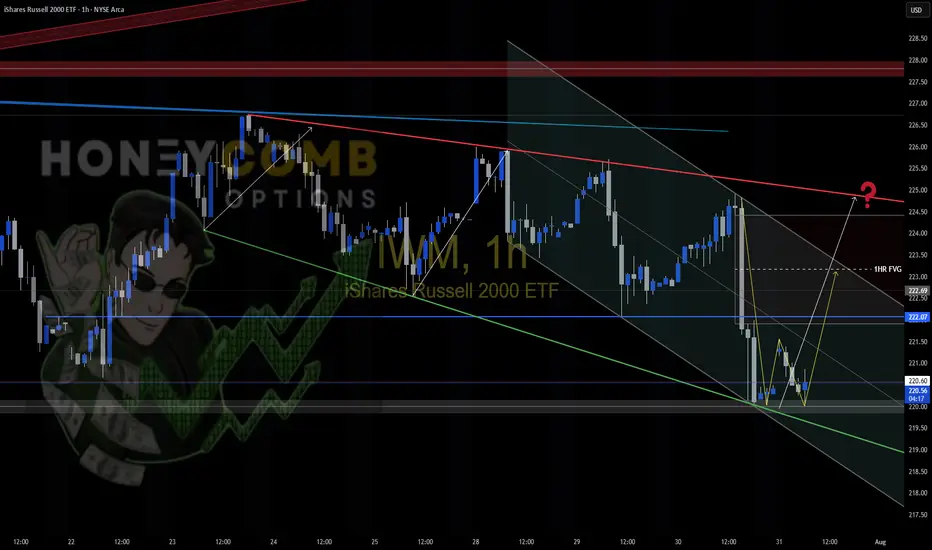
$IWM Analysis, Key Levels & Targets 8.4.25
Today’s Trading Range - we have a great range expansion here from last Friday’s drop. Some interesting targets here. Let me know what you see.
Look at this Battle zone today!! Grab this chart - and let’s go
Key stats
About iShares Russell 2000 ETF
Home page
Inception date
May 22, 2000
Structure
Open-Ended Fund
Replication method
Physical
Dividend treatment
Distributes
Distribution tax treatment
Qualified dividends
Income tax type
Capital Gains
Max ST capital gains rate
39.60%
Max LT capital gains rate
20.00%
Primary advisor
BlackRock Fund Advisors
Distributor
BlackRock Investments LLC
IWM is among the best choices in the crowded US small-cap field. The fund tracks the popular Russell 2000 index. IWM's broad basket makes it one of the most diversified funds in the segment. Notably, the fund delves into micro-cap territory, and has often been riskier than our neutral benchmark (as measured by beta) as a consequence. However, including micro-caps is a valid and possibly desirable approach to small-caps, and IWM looks reasonably similar to the benchmark in most other respects.
Related funds
Classification
What's in the fund
Exposure type
Finance
Health Technology
Technology Services
Stock breakdown by region
Top 10 holdings
Quantum's Missed IWM Short 8/1/25Well had a moment where I backed out of a A+++ setup. IWM had a ton of -gex pull down to 206. Would have been a massive short to end the week. I canceled my order instantly for no reason at all and missed it. Overall had a great day but this is what separates the elite from the average trader. Will

IWM Short1. Broader Market Structure 📉
1.1 Change of Character (CHoCH)
Occurred near the top (~226.70), breaking the prior higher low—signaling a shift from bullish to bearish momentum.
1.2 Break of Structure (BOS)
Confirmed by a move below that level, validating the bearish change and underlining a downt

IWM short 224 and 224.25Shorted IWM going into resistance
on daily. Target is 216 I will take 3/4 off re add when breaks
the 50 day 212.57 and 100 day 205.12 watch daily stoch see they roll over
Look weekly rolling over but needs break 68%. Look weekly making lower highs
See we can get a follow thru selling today with

The Ghost of 1986-1987 Stock Market Overlay onto $IWMThe 1986-1987 stock market advance was 48% as measured by the S&P500 Index SP:SPX from the low in late 1986 which peaked in August 1987 and crashed into October 19th's spectacular 20% decline in one day.
The advance in the Russell 2000 Index from the low in 2023 to the high in 2024 was 51%, toppi

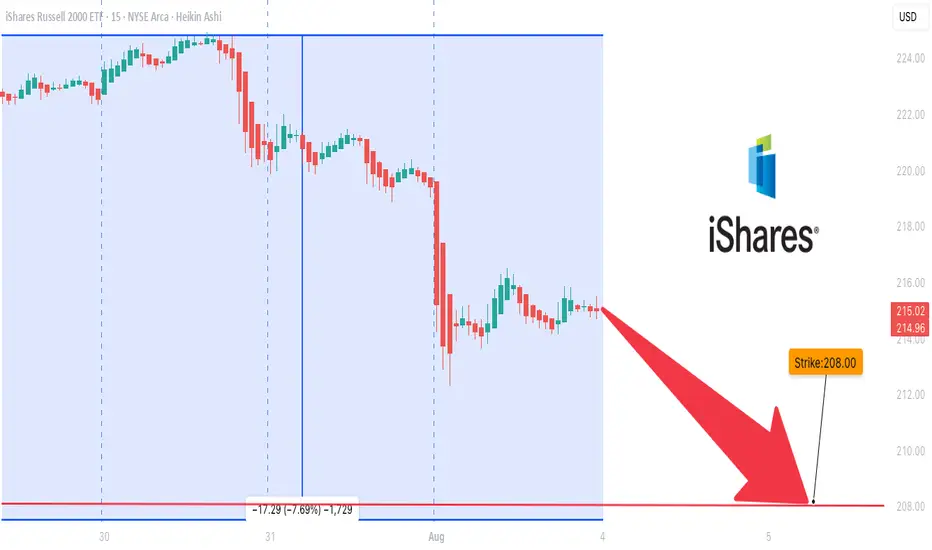
IWM is Overbought### ⚠️ \ AMEX:IWM Bearish Setup Alert — Weekly PUT Trade (Aug 3, 2025)
> **Momentum breakdown + institutional volume = high-probability short play**
📉 **Market Breakdown:**
* **📉 Daily RSI:** 34.9 → Bearish momentum under key 45 level
* **📊 Weekly RSI:** 53.0 → Neutral but slipping = trend weake

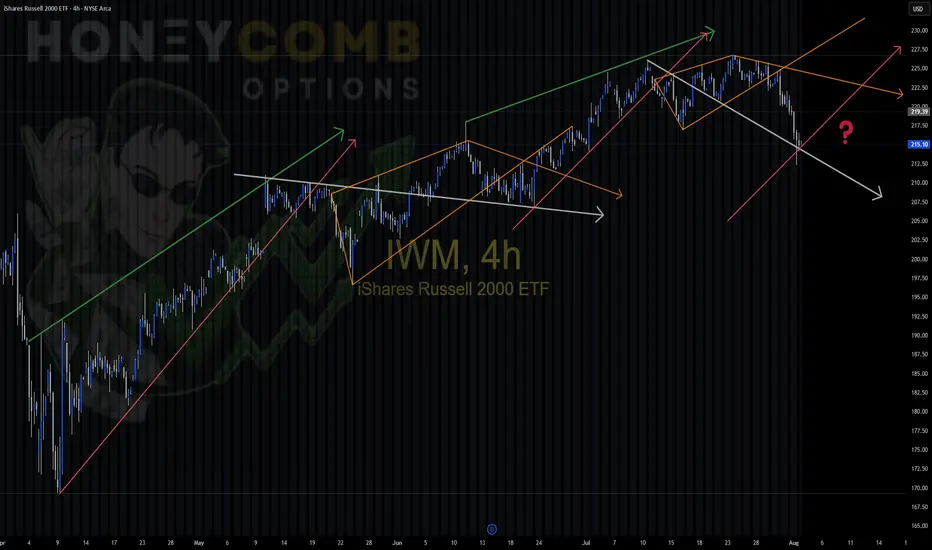
IWM repeating patterns IWM Playing around today noticed similar patterns in this uptrend, color coded for you convenience. Different sizes,, but the patterns are the same. Will we enter a new trend and start a different pattern, or will we stay in the same cycle?
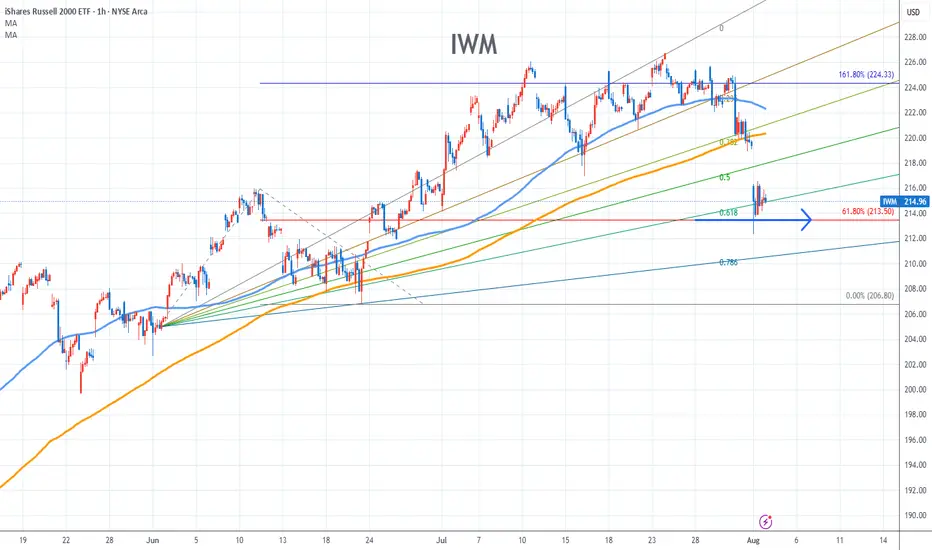
IWM Stock Chart Fibonacci Analysis 080125Trading Idea
1) Find a FIBO slingshot
2) Check FIBO 61.80% level
3) Entry Point > 214/61.80%
Chart time frame:B
A) 15 min(1W-3M)
B) 1 hr(3M-6M)
C) 4 hr(6M-1year)
D) 1 day(1-3years)
Stock progress:C
A) Keep rising over 61.80% resistance
B) 61.80% resistance
C) 61.80% support
D) Hit the bottom
E)
IWM SETUP. Looks good for a long.Bouncing off the trendline where it was supposed to. Will it get to the top of the broadening wedge?
See all ideas
Summarizing what the indicators are suggesting.
Oscillators
Neutral
SellBuy
Strong sellStrong buy
Strong sellSellNeutralBuyStrong buy
Oscillators
Neutral
SellBuy
Strong sellStrong buy
Strong sellSellNeutralBuyStrong buy
Summary
Neutral
SellBuy
Strong sellStrong buy
Strong sellSellNeutralBuyStrong buy
Summary
Neutral
SellBuy
Strong sellStrong buy
Strong sellSellNeutralBuyStrong buy
Summary
Neutral
SellBuy
Strong sellStrong buy
Strong sellSellNeutralBuyStrong buy
Moving Averages
Neutral
SellBuy
Strong sellStrong buy
Strong sellSellNeutralBuyStrong buy
Moving Averages
Neutral
SellBuy
Strong sellStrong buy
Strong sellSellNeutralBuyStrong buy
Displays a symbol's price movements over previous years to identify recurring trends.
Frequently Asked Questions
An exchange-traded fund (ETF) is a collection of assets (stocks, bonds, commodities, etc.) that track an underlying index and can be bought on an exchange like individual stocks.
IWM trades at 219.73 USD today, its price has risen 2.24% in the past 24 hours. Track more dynamics on IWM price chart.
IWM net asset value is 215.09 today — it's fallen 1.28% over the past month. NAV represents the total value of the fund's assets less liabilities and serves as a gauge of the fund's performance.
IWM assets under management is 60.64 B USD. AUM is an important metric as it reflects the fund's size and can serve as a gauge of how successful the fund is in attracting investors, which, in its turn, can influence decision-making.
IWM price has fallen by −1.03% over the last month, and its yearly performance shows a 5.21% increase. See more dynamics on IWM price chart.
NAV returns, another gauge of an ETF dynamics, have risen by −1.28% over the last month, have fallen by −1.28% over the last month, showed a 7.53% increase in three-month performance and has decreased by −2.69% in a year.
NAV returns, another gauge of an ETF dynamics, have risen by −1.28% over the last month, have fallen by −1.28% over the last month, showed a 7.53% increase in three-month performance and has decreased by −2.69% in a year.
IWM fund flows account for −10.51 B USD (1 year). Many traders use this metric to get insight into investors' sentiment and evaluate whether it's time to buy or sell the fund.
Since ETFs work like an individual stock, they can be bought and sold on exchanges (e.g. NASDAQ, NYSE, EURONEXT). As it happens with stocks, you need to select a brokerage to access trading. Explore our list of available brokers to find the one to help execute your strategies. Don't forget to do your research before getting to trading. Explore ETFs metrics in our ETF screener to find a reliable opportunity.
IWM invests in stocks. See more details in our Analysis section.
IWM expense ratio is 0.19%. It's an important metric for helping traders understand the fund's operating costs relative to assets and how expensive it would be to hold the fund.
No, IWM isn't leveraged, meaning it doesn't use borrowings or financial derivatives to magnify the performance of the underlying assets or index it follows.
In some ways, ETFs are safe investments, but in a broader sense, they're not safer than any other asset, so it's crucial to analyze a fund before investing. But if your research gives a vague answer, you can always refer to technical analysis.
Today, IWM technical analysis shows the buy rating and its 1-week rating is buy. Since market conditions are prone to changes, it's worth looking a bit further into the future — according to the 1-month rating IWM shows the strong buy signal. See more of IWM technicals for a more comprehensive analysis.
Today, IWM technical analysis shows the buy rating and its 1-week rating is buy. Since market conditions are prone to changes, it's worth looking a bit further into the future — according to the 1-month rating IWM shows the strong buy signal. See more of IWM technicals for a more comprehensive analysis.
Yes, IWM pays dividends to its holders with the dividend yield of 1.15%.
IWM trades at a premium (0.08%).
Premium/discount to NAV expresses the difference between the ETF’s price and its NAV value. A positive percentage indicates a premium, meaning the ETF trades at a higher price than the calculated NAV. Conversely, a negative percentage indicates a discount, suggesting the ETF trades at a lower price than NAV.
Premium/discount to NAV expresses the difference between the ETF’s price and its NAV value. A positive percentage indicates a premium, meaning the ETF trades at a higher price than the calculated NAV. Conversely, a negative percentage indicates a discount, suggesting the ETF trades at a lower price than NAV.
IWM shares are issued by BlackRock, Inc.
IWM follows the Russell 2000. ETFs usually track some benchmark seeking to replicate its performance and guide asset selection and objectives.
The fund started trading on May 22, 2000.
The fund's management style is passive, meaning it's aiming to replicate the performance of the underlying index by holding assets in the same proportions as the index. The goal is to match the index's returns.