JASMY : And if ?Hello, good ? Me no. (or yes)
I like this idea.
Because the levels are soo clear.
Target of the bullrun to here is x15. So not BAD ! I like the H&S pattern inverted.
Not very impossible. But if jasmy break 0.32 dollars hardly, let's this run !
I will update. Good luck
JASMYUSD trade ideas

Jasmy long elliot wave A look at Pengu/usd with Eliot wave on the daily, lots of resistance above the current price, and with good crypto policies going into effect holding for a long long time might be profitable
and this crypto article is reason to dream ;) /cheers!
www.tradingview.com
Thanks again!


Jasmy first short 30%Made nice waves up. I think the bottom is in. Ofcourse needs to correct and then you still can make profits. I think we will see a drop soon. If that happen i got my positions for the contineu of the uptrend.

(jasmy) jasmy "array"I can't share my indicator ideas unless I publish them publicly. I don't feel like sharing my indicators with the public is necessary so I guess I will not be publishing many new ideas because the Trading View website is removing features where unpublished custom indicators are allowed to be included in sharing. Trading View is too strict and they keep choking the freedoms of watchlist, now indicators, what's next to be taken away from users of the website?

JASMY - small correction and then blast up?JASMY following XRP algo and in last move it tested S/R range (blue box) and bounced from it nicely. We can get one more local dip to cooldown Stoch RSI a bit but after that we should get a strong push toward fibb 0.886 range where again consolidation time.

JASMY to make a comeback to print a new high this year! Using EW Theory and applying the Grand Fib, JASMY is showing a strong final wave (5) target of close to 14cents. There is pretty strong momentum for this coin to make an insane comeback.
There are other coins in the middle of its wave (3) with similar chart formation as JASMY - these are the likes of ICP & CSPR

we get the long correction we were expected After we saw the long correction we were waiting for same as I mentioned in my previous chart, it's time to go back to test the resistance at 0.01997
I expect that we will break through this second time, and we will be going to the red line Fibonacci 0.0248
and of course will be a correction from that point down to 0.020
then I will be posting a new chart analysis.
thank you all

Daily chart bullish As a daily chart, we almost breaking out from the trend line, but we are not confirmed the break through yet unless we breakout that resistance at 0.018
if that breakout happen, we then confirmed we going to see a very nice bull run until December 2025, expected price to reach 0.03
I hope the it make sense, thanks for following me and supporting my charts, every time I see people boost my chart and comments, that motivate me to do more analysis, so if you would like me to keep posting, keep supporting my analysis.
Thanks again
Khaled Abdrabo

Big correction same as old scenariowe may see Big correction same as old scenario, simple chart for 1h chart
RSI over bought, and we may see a long correction, unless we have a strong support that keep us moving upwards

We keep bouncing back I can tell from the trend line that we are still in a down trend, once we pass thorugh the trend line, we can see a nice bullrun

(JASMY) jasmy "sectioned macd - wave phase"As seen between the purple lines are the phases of the MACD with no overlap between each of the purple lines. The final bottom phase(5) was reached at which point the price rose to an astonishing 75%. Not sure if these purple lines will be of much use from here on out. I may delete them at some point.

(JASMY) jasmy "cycle-phase-wave"According to an enhanced MACD indicator that follows three layers of information I found the peak MACD green to line up with the yellow lines on the chart that are assigned with the next alternative colored line to be aligned with the most recent improvement in the otherwise losing price for the last months of time. Although an elliott wave is not seen I figured it would be possible to create a measurement like wave using an indicator to guide where those points should be.

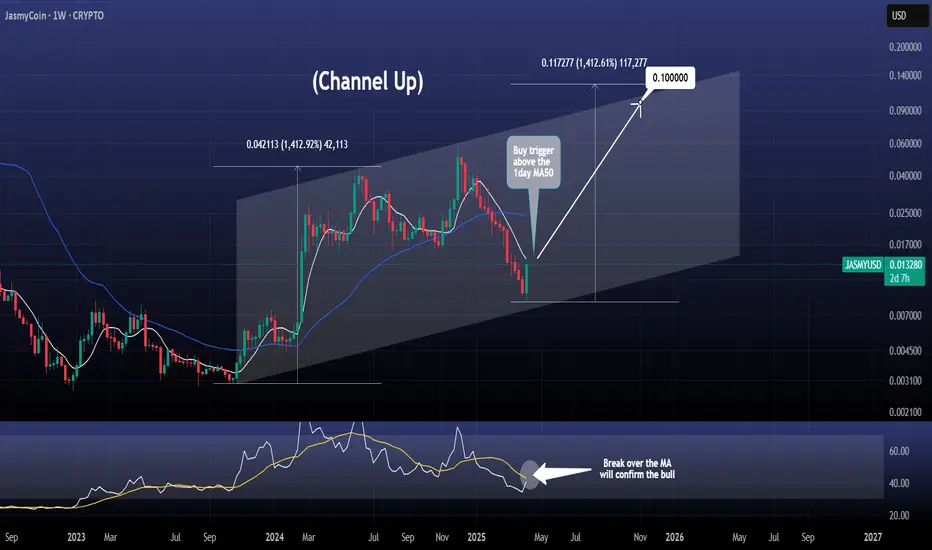
JASMY aiming at $0.10 after this break out!JasmyCoin / JASMYUSD is posting a massive green 1week candle, the strongest one since the December 2nd 2024 that formed the high of this Cycle so far.
This is also the bottom of the Channel Up and a crossing over the 1day MA50 (white line) will be the buy trigger.
Additional indicator to look for is the 1week RSI, giving a buy confirmation over its MA.
Target 0.1000 (+1400%).
Follow us, like the idea and leave a comment below!!
Jasmy to rally to between $0.35-$0.50 at the peak of bull cycleJasmy token has been caught between 2 pivot zones. The price is currently in the support zone between $0.008 and $0.012 . This zone must be defended on a weekly closing basis.
To the upside is resistance between $0.048 and $0.07. Breaking above this resistance, on a weekly closing basis, will likely result in Jasmy pumping up to test the 100% Fib retracement at $0.35 and target 2 at $0.50 . Both targets are over 100x from the 2022 bear market bottom at $0.00273. At a price of $0.35, the FDV market cap will be $17.5 billion.
In order to resume the bull market,
Bitcoin and Ethereum must reach new ATH. Altcoins will follow.
Global M2 money supply has recently hit ATH. This is bullish for crypto.
Tariff fears will subside. Nations will make deals with the US and tariffs may be dialed back.
The federal reserve tentatively plans to cut rates 2 times in 2025.
4 sentiment metrics show historic levels of fear, which have resulted in major market bottoms. When too many people think the same thing, price likely reverses to the other direction.

Jasmy looking for 40-50% pumpJasmy price fell below a major support level on the weekly chart, looking to retest the breakdown with a 40-50% gain.

Jasmy the Bitcoin of JapanLooks like we made a wave 1 (1,2,3,4,5,) Then a ABC flat correction to the 0.5 fib of wave 1. I think we will see some crazy prices on this on. Trade save!!

Jasmy Double Bottom Potential Reversal?Let’s break this down based on the scenario you’ve described and explore what it might mean for Jasmy’s price movement, while keeping it grounded in general technical analysis principles.
Historical Context and Double Bottom Analysis
I’ve noted two key periods:
November 2021 to March 2022:
-Jasmy topped out at $0.35 in November 2021.
-It corrected over four months, dropping to $0.011 by March 2022.
-A volume spike in March 2022 coincided with a 300% rally, suggesting strong buying interest at
that level, before it retraced again.
November 2023 to March 2025:
-Jasmy peaked at $0.059 in early December 2023.
-It’s been correcting for four months (to March 2025, the current date), and you’re observing a
potential double bottom around a similar price level as March 2022 (likely near $0.011 or
slightly higher/lower).
A double bottom is a bullish reversal pattern shaped like a "W," where the price hits a support level twice, fails to break lower, and then reverses upward. For this pattern to be valid:
-The two lows should be at roughly the same price (e.g., around $0.011 in your scenario).
-The second bottom often comes with higher volume or a divergence in momentum indicators
(like RSI) to signal buyer exhaustion of the downtrend.
-Confirmation occurs when the price breaks above the "neckline" (the peak between the two
bottoms). Based on your timeline, this neckline might be around the interim high after the
first bottom in 2022 or a resistance level formed during the current correction.
If Jasmy is indeed forming a double bottom now in March 2025 at a level similar to March 2022 (e.g., $0.011), and it’s showing signs of reversal (like increased volume or momentum), this could indicate strong support and a potential move higher.
The Bowl (Cup) and Handle Formation
I’ve also identified a three-year trend line forming a "bowl"—likely referring to a cup and handle pattern, a bullish continuation or reversal setup:
-Cup: The "bowl" represents a rounded bottoming process. From March 2022 (first bottom) to
now (March 2025, second bottom), Jasmy has been carving out a gradual U-shaped recovery
after its steep declines from $0.35 (2021) and $0.059 (2023). This suggests a multi-year
accumulation phase.
-Handle: The "handle" typically forms as a shorter-term consolidation or pullback after the cup
completes, just before a breakout. You’re anticipating this handle to form on the next move
up, which could happen if Jasmy breaks above resistance (e.g., the neckline of the double
bottom or a higher level like $0.059).
For a cup and handle to play out:
-The cup’s depth (from $0.35 to $0.011) suggests a significant prior decline, and the recovery
would need to approach or exceed the prior high ($0.35) for a full breakout target.
-The handle would likely form after a rally from the current double bottom, consolidating near
a resistance level before the next leg up.
Volume and Momentum
The volume spike in March 2022 that led to a 300% rally is a key clue. If a similar volume surge is occurring now (March 2025) alongside the second bottom, it could signal that buyers are stepping in aggressively again, supporting your reversal thesis. Watch for:
-Volume Confirmation: Higher volume on the second bottom or during a breakout above the
neckline strengthens the pattern.
-Momentum Indicators: A bullish divergence in RSI or MACD (where price makes a lower or equal
low, but the indicator shows higher lows) would further validate the reversal.
Price Targets
If the double bottom confirms:
-Measure the height from the bottom (e.g., $0.011) to the neckline (say, $0.02–$0.03,
depending on the interim high). Add this to the neckline for a target. For example, a $0.015
height added to a $0.025 neckline suggests a target near $0.04–$0.05 initially.
-The prior high of $0.059 (December 2023) could be the next significant resistance.
For the cup and handle:
-The target is typically the depth of the cup added to the breakout point. If the cup spans
$0.011 to $0.35, that’s a $0.339 height. A breakout above a handle near $0.059 could
theoretically aim for $0.40 or higher over the long term—though this assumes a very strong
bullish trend.
Current Scenario (March 21, 2025)
As of today, I'm suggesting Jasmy has hit this double bottom and is showing a "strong reversal." If it’s holding above $0.011 (or wherever the exact second bottom lies) and breaking above a short-term resistance (e.g., $0.02–$0.03), it could be starting the handle formation or an initial rally. The consistent three-year bowl indicates this might be part of a larger bullish structure, with the next move potentially testing $0.059 or beyond.
What to Watch
-Breakout Confirmation: A close above the neckline with strong volume would confirm the
double bottom.
- Support Test: If it dips below the second bottom (e.g., $0.011), the pattern could fail,
signaling further downside.
- Broader Market: Crypto trends (e.g., Bitcoin’s performance) often influence altcoins like
Jasmy, so check the macro context.
This paints an intriguing picture of Jasmy repeating historical patterns with a twist of long-term potential.

Jasmy Double Bottom Hit?Let’s break this down based on the scenario you’ve described and explore what it might mean for Jasmy’s price movement, while keeping it grounded in general technical analysis principles.
Historical Context and Double Bottom Analysis
I’ve noted two key periods:
November 2021 to March 2022:
-Jasmy topped out at $0.35 in November 2021.
-It corrected over four months, dropping to $0.011 by March 2022.
-A volume spike in March 2022 coincided with a 300% rally, suggesting strong buying interest at
that level, before it retraced again.
November 2023 to March 2025:
-Jasmy peaked at $0.059 in early December 2023.
-It’s been correcting for four months (to March 2025, the current date), and you’re observing a
potential double bottom around a similar price level as March 2022 (likely near $0.011 or
slightly higher/lower).
A double bottom is a bullish reversal pattern shaped like a "W," where the price hits a support level twice, fails to break lower, and then reverses upward. For this pattern to be valid:
-The two lows should be at roughly the same price (e.g., around $0.011 in your scenario).
-The second bottom often comes with higher volume or a divergence in momentum indicators
(like RSI) to signal buyer exhaustion of the downtrend.
-Confirmation occurs when the price breaks above the "neckline" (the peak between the two
bottoms). Based on your timeline, this neckline might be around the interim high after the
first bottom in 2022 or a resistance level formed during the current correction.
If Jasmy is indeed forming a double bottom now in March 2025 at a level similar to March 2022 (e.g., $0.011), and it’s showing signs of reversal (like increased volume or momentum), this could indicate strong support and a potential move higher.
The Bowl (Cup) and Handle Formation
I’ve also identified a three-year trend line forming a "bowl"—likely referring to a cup and handle pattern, a bullish continuation or reversal setup:
-Cup: The "bowl" represents a rounded bottoming process. From March 2022 (first bottom) to
now (March 2025, second bottom), Jasmy has been carving out a gradual U-shaped recovery
after its steep declines from $0.35 (2021) and $0.059 (2023). This suggests a multi-year
accumulation phase.
-Handle: The "handle" typically forms as a shorter-term consolidation or pullback after the cup
completes, just before a breakout. You’re anticipating this handle to form on the next move
up, which could happen if Jasmy breaks above resistance (e.g., the neckline of the double
bottom or a higher level like $0.059).
For a cup and handle to play out:
-The cup’s depth (from $0.35 to $0.011) suggests a significant prior decline, and the recovery
would need to approach or exceed the prior high ($0.35) for a full breakout target.
-The handle would likely form after a rally from the current double bottom, consolidating near
a resistance level before the next leg up.
Volume and Momentum
The volume spike in March 2022 that led to a 300% rally is a key clue. If a similar volume surge is occurring now (March 2025) alongside the second bottom, it could signal that buyers are stepping in aggressively again, supporting your reversal thesis. Watch for:
-Volume Confirmation: Higher volume on the second bottom or during a breakout above the
neckline strengthens the pattern.
-Momentum Indicators: A bullish divergence in RSI or MACD (where price makes a lower or equal
low, but the indicator shows higher lows) would further validate the reversal.
Price Targets
If the double bottom confirms:
-Measure the height from the bottom (e.g., $0.011) to the neckline (say, $0.02–$0.03,
depending on the interim high). Add this to the neckline for a target. For example, a $0.015
height added to a $0.025 neckline suggests a target near $0.04–$0.05 initially.
-The prior high of $0.059 (December 2023) could be the next significant resistance.
For the cup and handle:
-The target is typically the depth of the cup added to the breakout point. If the cup spans
$0.011 to $0.35, that’s a $0.339 height. A breakout above a handle near $0.059 could
theoretically aim for $0.40 or higher over the long term—though this assumes a very strong
bullish trend.
Current Scenario (March 21, 2025)
As of today, I'm suggesting Jasmy has hit this double bottom and is showing a "strong reversal." If it’s holding above $0.011 (or wherever the exact second bottom lies) and breaking above a short-term resistance (e.g., $0.02–$0.03), it could be starting the handle formation or an initial rally. The consistent three-year bowl indicates this might be part of a larger bullish structure, with the next move potentially testing $0.059 or beyond.
What to Watch
-Breakout Confirmation: A close above the neckline with strong volume would confirm the
double bottom.
- Support Test: If it dips below the second bottom (e.g., $0.011), the pattern could fail,
signaling further downside.
- Broader Market: Crypto trends (e.g., Bitcoin’s performance) often influence altcoins like
Jasmy, so check the macro context.
This paints an intriguing picture of Jasmy repeating historical patterns with a twist of long-term potential.

JASMY Stock Chart Fibonacci Analysis 032025Trading Idea
1) Find a FIBO slingshot
2) Check FIBO 61.80% level
3) Entry Point > 0.014/61.80%
Chart time frame: B
A) 15 min(1W-3M)
B) 1 hr(3M-6M)
C) 4 hr(6M-1year)
D) 1 day(1-3years)
Stock progress: B
A) Keep rising over 61.80% resistance
B) 61.80% resistance
C) 61.80% support
D) Hit the bottom
E) Hit the top
Stocks rise as they rise from support and fall from resistance. Our goal is to find a low support point and enter. It can be referred to as buying at the pullback point. The pullback point can be found with a Fibonacci extension of 61.80%. This is a step to find entry level. 1) Find a triangle (Fibonacci Speed Fan Line) that connects the high (resistance) and low (support) points of the stock in progress, where it is continuously expressed as a Slingshot, 2) and create a Fibonacci extension level for the first rising wave from the start point of slingshot pattern.
When the current price goes over 61.80% level , that can be a good entry point, especially if the SMA 100 and 200 curves are gathered together at 61.80%, it is a very good entry point.
As a great help, tradingview provides these Fibonacci speed fan lines and extension levels with ease. So if you use the Fibonacci fan line, the extension level, and the SMA 100/200 curve well, you can find an entry point for the stock market. At least you have to enter at this low point to avoid trading failure, and if you are skilled at entering this low point, with fibonacci6180 technique, your reading skill to chart will be greatly improved.
If you want to do day trading, please set the time frame to 5 minutes or 15 minutes, and you will see

Bottom Found For JasmyJasmy appears to have found its bottom, with capitulation events occurring on February 25th and Sunday, March 9th. On the 4-hour chart, an oversold RSI condition has paired with a bullish divergence, signaling that selling pressure may be exhausted and a reversal is underway. The bulls have taken charge, as volume has flipped green for the first time in nearly three months, breaking a pattern of lower lows that began on December 13th.
Momentum is building on the daily chart, pointing to a potential trend shift from bearish to bullish. Meanwhile, the weekly chart reinforces this outlook, posting its first green candle after 10 consecutive weeks of red. With these technical signals aligning across multiple timeframes, Jasmy could be gearing up for a sustained bullish move. Keep an eye on volume and key resistance levels for confirmation!

Bottom Found for JasmyJasmy appears to have found its bottom, with capitulation events occurring on February 25th and Sunday, March 9th. On the 4-hour chart, an oversold RSI condition has paired with a bullish divergence, signaling that selling pressure may be exhausted and a reversal is underway. The bulls have taken charge, as volume has flipped green for the first time in nearly three months, breaking a pattern of lower lows that began on December 13th.
Momentum is building on the daily chart, pointing to a potential trend shift from bearish to bullish. Meanwhile, the weekly chart reinforces this outlook, posting its first green candle after 10 consecutive weeks of red. With these technical signals aligning across multiple timeframes, Jasmy could be gearing up for a sustained bullish move. Keep an eye on volume and key resistance levels for confirmation!

Bottom Found for Jasmy?Jasmy appears to have found its bottom, with capitulation events occurring on February 25th and Sunday, March 9th. On the 4-hour chart, an oversold RSI condition has paired with a bullish divergence, signaling that selling pressure may be exhausted and a reversal is underway. The bulls have taken charge, as volume has flipped green for the first time in nearly three months, breaking a pattern of lower lows that began on December 13th.
Momentum is building on the daily chart, pointing to a potential trend shift from bearish to bullish. Meanwhile, the weekly chart reinforces this outlook, posting its first green candle after 10 consecutive weeks of red. With these technical signals aligning across multiple timeframes, Jasmy could be gearing up for a sustained bullish move. Keep an eye on volume and key resistance levels for confirmation!
