JASMY DAILY DEADLY BLOOD DIAMOND 1DAYNow this would be the ultimate short right here. 3TPs all ready and set. This will be an epic short thats for sure. I see a blood diamond on the one day. There is a huge bear div on momentum+money flow is down+rsi and Stochrsi about to drop below the 70 line. I see price moving into all fibs and clearing all vector zones on the way down. SUPER BEARISH! THIS IS A MUST WATCH
JASMYUSDT.PS trade ideas

JASMY Falling WedgeThis wedge looks pretty solid, wouldn't be surprised to see JASMY continue to break lower

JASMY Local Re-DistributionThis is a local re-distribution on Jasmy after the initial rejection from the 2 week supply.
I'm expecting it to continue down from here.
Targets / Ideal re-entry points are: $0.0153 / $0.00794 / $0.00545 / $0.0041 / $0.00324

JASMY USD LONG READY TO FLY TARGET 0.03500JASMY USDT RISE READY INVESTMENT
Long 0.018877
Tp1 0.02525
Tp2 0.03500
tp3 0.03900
Stop 0.012693


Jasmy Price predictionDear Traders,
i see jasmy on weekly going up to theese targets but from now to 1 week it may dump to 18 20 where it was before

JASMYUSDT BUY NOW 0.044 SOON!!!!!!!!!!!!!JASMY completed three targets from my sell entry now we got a breakouts from the buy side of the falling wedge am waiting for the retest for a buys because price is heading to sweep or run liquidity above 0.044
TELL US YOUR VIEWS ON JASMY

jasmy short setupjasmy short setup. We can see change of character here. so we will see drop to the previous buy order block.

JASMY ANALYSIS🔮As we said earlier, #JASMY performed same. Around 113% movement after we post our analysis.
Now we can see that there is a formation of "Falling Wedge Pattern" in #JASMY. Also there is a perfect breakout 👌 We will see a bullish move of around 20% in few days
#DYOR

Jasmy 4HR BLOOD Diamond. Does it Print?A 4HR blood Diamond is trying to print for Jasmy. If this diamond can print, I'm looking for movement to the downside, clearing vector zone and hitting the golden pocket fib

JASMSY SHORT GOING VERY WELL jasmy trade setup perfect short open . those who open short congratulations u are in big profit right now . every one saying that jasmy going to moon . u can check my comments about that .

JASMY short setup ALL trading ideas have entry point + stop loss + take profit + Risk level.
hello Traders, here is the full analysis for this pair, let me know in the comment section below if you have any questions, the entry will be taken only if all rules of the strategies will be satisfied. I suggest you keep this pair on your watchlist and see if the rules of your strategy are satisfied. Please also refer to the Important Risk Notice linked below.
Disclaimer

JASMY's Situation: What Shall we ExpectHi.
BINANCE:JASMYUSDT
As you can see, the price is in the ascending channel and has reached the ceiling of the channel and now we are correcting the price to the PRZ zone, then the price can grow well.
❗ Note that if the Triangle is broken down with the power of descending candles, our analysis will fail.
Traders, if you liked this idea or have your opinion on it, write in the comments, We will be glad.
Previous Analysis
_ _ _ _ __ _ _ _ _ _ _ _ _ _ _ _ _ _ _ _ _ _ _ _ _ _ _ _ _ _ _ _
✅Thank you, and for more ideas, hit ❤️Like❤️ and 🌟Follow🌟!
⚠️Things can change...
The markets are always changing and even with all these signals, the market changes tend to be strong and fast!!

JASMYUSDTAccording to the labeling that has been done and if it is correct, we can expect the start of an upward rally in the form of wave 5 of 3.. Spot buying around $0.0324 can be associated with less risk.

JASMYUSDT KEEP SELLING!!!!!!!!!!!Jasmy made a possible breakouts with multiple retest at 0.040 level we tighten our stoploss to 0.041 and closed over two measure targets now am expecting the price to break measure area at 0.033 to 0.029
JOIN AND ENJOY
Tell us your views.............

JASMYUSDT: Bullish TrendJASMYUSDT is moving perfect bullish trend and forming HHs and HLs, currently JASMY if formed strong bullish divergence on 1hr time frame, so this is another confirmation of the bullish tend so we will wait for the break of the pattern and take a long entry.

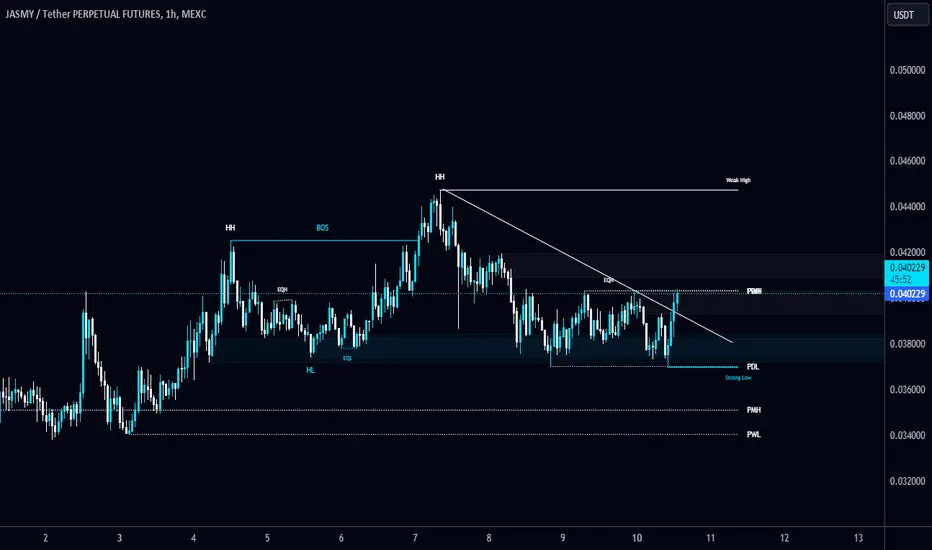
#JASMY/USDT breaks the Diagonal Trendline in 1-Hour TF!#JASMY/USDT breaks the Diagonal Trendline in 1-Hour TF!
SEED_DONKEYDAN_MARKET_CAP:JASMY looks bullish here and retested too. The local resistance level is $0.0447, and local support level is $0.036985.
$JASMY Bullish Pennent on daily and weekly TF !
Trading in a bullish pennant pattern involves recognizing the setup and then executing trades based on the pattern's characteristics. Here are three key points to consider:
### 1. Identify the Pattern
- **Formation**: A bullish pennant forms after a strong upward movement (flagpole), followed by a brief consolidation period with converging trendlines that create a small symmetrical triangle.
- **Volume**: The volume typically decreases during the consolidation phase and should increase upon breakout.
- **Duration**: This pattern usually develops over a period of one to three weeks.
### 2. Confirm the Breakout
- **Breakout Point**: Enter a trade when the price breaks above the upper trendline of the pennant with increased volume.
- **Validation**: Ensure the breakout is supported by higher trading volumes, which confirms the strength and likelihood of continuation.
- **Entry Strategy**: Place a buy order slightly above the breakout point to avoid false breakouts.
### 3. Manage the Trade
- **Target Price**: Estimate the target price by measuring the length of the flagpole (the initial price increase) and adding it to the breakout point.
- **Stop-Loss Order**: Place a stop-loss order below the lower trendline of the pennant to protect against downside risk.
- **Monitor**: Continuously monitor the trade, adjusting stop-loss levels to lock in profits as the price moves in your favor.
By following these steps, traders can effectively capitalize on the bullish pennant pattern and manage their risk appropriately.

JASMYUSDT.1DIn my professional analysis of the JASMY/USDT daily chart, several key observations can be made based on the technical indicators and price patterns observed:
Support and Resistance Levels: The chart outlines two primary resistance levels at $0.024954 (R1) and $0.051063 (R2), with support levels at $0.013466 (S1) and a lower boundary around $0.013466 (S2). Currently, the price is near S1, which it has tested recently. Holding this level could be crucial for preventing further declines.
Price Movements and Patterns: The recent pattern shows a sharp rise followed by a period of consolidation. This could indicate that the market is deciding its next major move. The presence of a lower resistance at R1 and the subsequent higher resistance at R2 suggests that breaking above R1 might lead to a quick move towards R2 if bullish momentum increases.
Technical Indicators:
Relative Strength Index (RSI): The RSI is below 50, which typically indicates bearish momentum. However, it is close to this midline, which could signal that the downward pressure is weakening.
Moving Average Convergence Divergence (MACD): The MACD line is above the signal line but close to crossing below, which could suggest a potential change in momentum. It's crucial to watch this indicator closely for early signs of a trend reversal or continuation.
Trading Strategy: Given the current support at S1, traders might consider this an opportunity to buy, aiming for a short-term target at R1. However, due to the potential volatility and the nearness of the MACD lines to a bearish crossover, setting a tight stop-loss just below S1 could help manage risk effectively.
Risk Management: The proximity of the current price to the support level means risk management is crucial. A break below S1 could see the price heading towards S2, representing a significant drop. Hence, maintaining a disciplined approach with clear stop-loss orders is recommended.
Conclusion: The JASMY/USDT pair shows potential for a rebound if it holds the support at S1. The targets to watch would be R1 and potentially R2 if the momentum is strong enough. However, the risk of a further decline remains if the support at S1 does not hold, making vigilant monitoring of price action and technical indicators essential for timely decision-making. This setup offers a balanced risk-reward scenario that requires careful attention to both entry and exit strategies.

JASMY/USDT SELL NOW!!!!!!!!!Jasmyusdt have been making an uptrends for days and now price just took out the sell side liquidity am expecting a minor retracement from the premium zone then sell off from there till 0.023947 is completed
JOIN AND ENJOY
Tell us what you think...................?

JASMYUSDTMy entry on this trade idea is taken from a point of interest BELOW an inducement.. I extended my stoploss area to cover for the whole swing as price can target the liquidity there before going as i anticipate.. just a trade idea, not financial advise

I Cannot Short This !!! situation+next targets.BINANCE:JASMYUSDT broke out the bull Pennant on 3D timeframe
Up we go📈
Traders, if you liked this idea or have your opinion on it, write in the comments, We will be glad.
_ _ _ _ _ _ _ _ _ _ _ _ _ _ _ _ _ _ _ _ _ _ _ _ _ _ _ _ _ _ _ _ _
✅Thank you, and for more ideas, hit ❤️Like❤️ and 🌟Follow🌟!
⚠️Things can change...
The markets are always changing and even with all these signals, the market changes tend to be strong and fast!!

$JASMY tested Bull Flag support, plus Cup & Handle formationHere on SEED_DONKEYDAN_MARKET_CAP:JASMY , a classic Cup & Handle formation, target 0.0345
But at the same time, we have a Bull Flag with already tested support, with target on 0.046!
