$JASMY tested Bull Flag support, plus Cup & Handle formationHere on SEED_DONKEYDAN_MARKET_CAP:JASMY , a classic Cup & Handle formation, target 0.0345
But at the same time, we have a Bull Flag with already tested support, with target on 0.046!
JASMYUSDT.PS trade ideas

#JASMY/USDT looks heavy in 1-Hour TF!#JASMY/USDT looks heavy in 1-Hour TF!
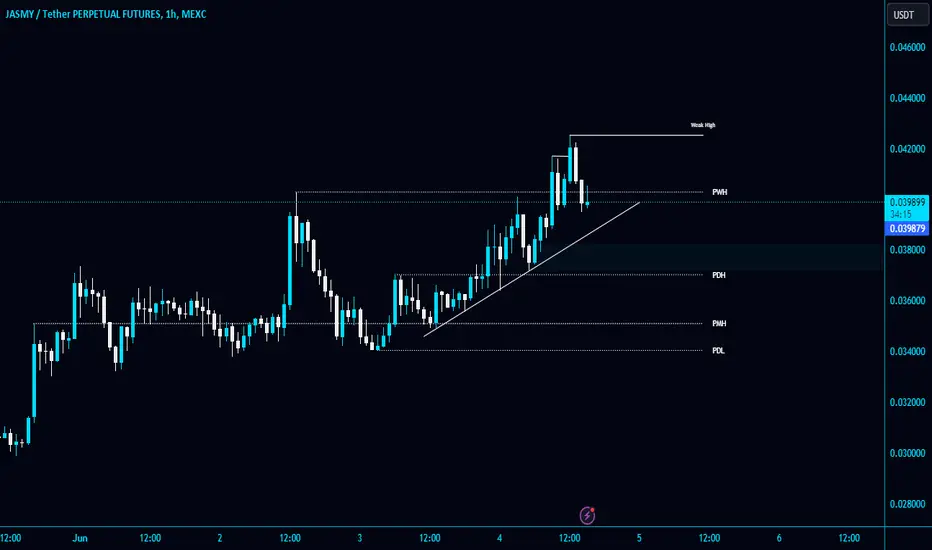
SEED_DONKEYDAN_MARKET_CAP:JASMY needs to hold this trendline to remain bullish. I will wait for the breakdown to shorten it. #JASMYUSDT breaking PWH $0.04030.
Jasmy go to 1.618 fibo extensionJasmy Usdt, go to 1.618 fibo extension. The token has broken out from a huge bull flag, starting its strong rally that is expected to reach the aforementioned fibo extension region.

flag???A beautiful green flag pattern can be completed if
it can break the red ceiling firmly
previous months
With the breaking of the ceiling of the blue pattern,
a beautiful growth of %230 can be seen

JASMY strong upward movement, breaking past the resistance level
Key Support and Resistance Levels:
Immediate Support: $0.024512
Primary Support: $0.014300
Immediate Resistance: $0.045934
Primary Resistance: $0.068500
Trend Analysis:
The price has experienced a strong upward movement, breaking past the $0.035000 resistance level. The current price of $0.039087 indicates a bullish trend, reinforced by the recent upward trajectory.
Indicator Analysis:
Stochastic RSI: Currently at 65.31 and 39.42, indicating the price is in a bullish zone but not yet overbought, suggesting potential for further upward movement.
CVD (Cumulative Volume Delta): Shows a positive volume trend of 102.706M, supporting the bullish momentum.
Potential Price Targets:
Short-Term Target: The immediate resistance at $0.045934, if broken, could lead to the next target at $0.068500.
Long-Term Target: Should the bullish momentum continue, the price might aim for higher resistance levels beyond $0.068500.
Strategic Outlook:
The breakout above $0.035000 suggests a bullish sentiment. Traders should watch the $0.045934 resistance closely, as a breach could propel the price towards $0.068500. Conversely, a pullback might find support at $0.024512 or lower at $0.014300.
Conclusion:
The JASMY/USDT chart signals a robust bullish trend with significant potential for further gains. Key resistance levels are crucial to watch for potential breakouts, while support levels provide downside protection.

$jasmy is going higher Hello everyone. Hope you guys doing well. SEED_DONKEYDAN_MARKET_CAP:JASMY broke out of the range and is heading towards 0.5 of the yearly range. Hope you guys liked my idea.
Much love
RB

JASMY Idea - Update for bullish trendHere's the rewritten text in a friendly tone:
Hey Traders! I noticed something interesting on the JASMYUSDT chart.
The price bumped up against the 30 and 60-moving averages on the 4-hour timeframe, which can sometimes act as a bit of a hurdle. But things are looking positive! There's more trading happening in the crypto market lately, especially with altcoins, and other coins are on the rise too. This overall positive sentiment, along with the technical stuff on the chart, suggests JASMYUSDT could be due for a climb. Just like we're seeing with other cryptocurrencies!
Here's the exciting part: If the price on the 30-minute chart breaks above the recent high and crosses above both the 30 and 60-moving averages in 30-Min and 15-Min charts, that could be a good sign for a buying opportunity.
Targets:
$0.04020 and $0.04200

#JASMY/USDT#JASMY
We have a bearish channel pattern on a 2-day frame, within which the price moves and adheres to its limits well
We have a green support area at 0.01500 after the price touched it and bounced from it
We have a tendency to stabilize above moving average 100
We have a downtrend on the RSI indicator that supports the price higher
Entry price is 0.02000
The first target is 0.02400
The second goal is 0.02660
The third goal is 0.03000

JASMYUSDT Flag Pattern!JASMYUSDT Technical analysis update
JASMY price formed a bull flag pattern on the daily chart. With a breakout accompanied by high volume, we can expect a bullish continuation.
Buy zone : Below $0.0260
Stop loss : $0.0217
Regards
Hexa

JASMY IdeaIf the price does not breaking the bottom of the channel, (due to the end of the fifth wave in the 4-hour chart), then after hitting the bottom of the channel as well as hitting the 30-MA. there is possibility to return to top of the channel.
Pay attention: that the closing of the ascending candlestick inside the chanel, and then, passaging the next ascending candle above the highest price of the closed candle, is a buy signal.

JASMY PriceThe Jasmycoin (JASMY) continued to uplift gains and rallied over 120% this month. Amidst the market uncertainty, JASMY price persisted to emerge and reached the blue sky zone.

JASMY/USDT
INTERESTING VOLUME WITH RESISTANCE BREAKS
Price: selling of a buildup of more than 2 years, breakout of the symmetrical triangle at the top. looking for key points of the Fibonacci retracement 0.38 - 0.61; clearly the initial market price.
RSI: leaving the oversold zone growing positively

Alikze »» JASMY | Ascending channel🔍 Technical analysis: Ascending channel
In daily time, 1D is moving in an ascending channel.
💎 According to the pullback to the broken structure and the major roof, this upward movement can continue until the next area and the roof of the channel.
Considering that it is currently in the middle of the channel, the candlestick above the area reinforces the bullish structure.
💎 Alternative scenario: In addition, according to the trading node in the range of 0.024414, which is also around the bottom of the channel, in case of a break, the correction zone can continue until the liquidity zone.
»»»«««»»»«««»»»«««
Please support this idea with a LIKE and COMMENT if you find it useful and Click "Follow" on our profile if you'd like these trade ideas delivered straight to your email in the future.
Thanks for your continued support.
Best Regards,❤️
Alikze.
»»»«««»»»«««»»»«««

Partnership with AAPL?At this point they are just rumors as far as I'm concerned....
HOWEVER,
This coin has been on a tear and resistant to all down moves in the general market. I'm in long and continuing to buy on dips..

Long JASMY
JASMY consolidating above the current range. If this level holds, JASMY will have a small rally to reach $0.38.
This price is also the target of the proposed set-up.
Invalidation is when price falls back in the range (below $0.244)
Disclaimer:
This analysis is based on my personnal views and is not a financial advice. Risk is under your control.

Jasmy OutlookJasmy has broken out and reached the top of the channel.
I can see a 5 wave structure to the upside and expecting an A,B,C correction before we rally higher.

JASMY: Potential Bullish Pennant Breakout!Hey everyone! If you enjoy this content, please consider giving it a thumbs up and following for more analysis.
JASMY is currently testing the top of a potential bull pennant pattern on the daily timeframe. A confirmed breakout could signal further bullish momentum. Buy some now and add more in the dip.
What to Watch For:
Confirmation of Breakout: A daily close above the resistance level of the pennant strengthens the bullish case.
Volume: Higher trading volume on the breakout can increase confidence in the signal.
Possible Entry & Targets (for educational purposes only):
Entry: $0.021-$0.024
Potential Targets: 300-400%
Stop-Loss: $0.018 (Consider setting a stop-loss based on your risk tolerance strategy)
Let's Discuss!
What are your thoughts on JASMY's current price action? Do you see a bullish pattern? Share your analysis in the comments below!

JASMYUSDT Bull Flag Breakout Targeting 1.618 Fibonacci ExtensionJASMY is currently breaking free from what appears to be a tight Bull Flag that it's formed at the locals highs. A move above the consolidation zone could take JASMY to extremely higher highs as beyond 4.9 cents lies no resistance at all and only a history of moving straight up and down which can be seen on the older spot chart of this coin. With that in mind, one would think it could trade as high as 2 dollars if the resistance were to break.

he bullish Pennant ( flag)the possibility of the bullish Pennant ( flag) as a classic bullish pattern - ...normally we need to see high volume after breaking up the flag ( pennant) which we see now ... if the recent decrease a pullback and we resume upward , then Target can be around $0.1 ( size of the flagpole) ( IMHO)

JASMYUSDTIn exactly 20 days, SEED_DONKEYDAN_MARKET_CAP:JASMY reached the target I had anticipated, resulting in a 50% gain. Congratulations to everyone who benefited! If it maintains stability above the Fib1 resistance, the upward trend is expected to continue. The next target is Fib1.618.

JASMYUSDT Idea- PullbackHey traders!
JASMY has been on a strong run lately, reaching highs of $0.2890 on the daily and 4-hour charts. However, it's natural for any asset to experience pullbacks after a significant climb. In this case, JASMY found support around the 50% Fibonacci retracement level, which often acts as a historical buying zone. This area also coincides with daily resistance, indicating a potential turning point.
The good news? The bulls (investors hoping for price increases) seem to be back in charge! After the price correction, JASMY has shown renewed momentum and could be headed towards the $0.35600 price range.

JASMY BULLISH SETUPJASMY is consolidating for more than 100 days and is now ready explode hardly. A bullish momentum can lead 70 - 80% growth. Low leverage long position or spot call is recommended.

Jasmy new ATH👀Jasmy currently in consolidation period,there is very low volume in daily time frame,
As you can see if breakout comes with good volume then we can see new ATH
