JASMY Long setup: MASSIVE moveMajor trend reversal is in progress for Jasmine, As its currently retesting trend line on weekly chart,
Two entries are shown in chart based on my golden 0.5 and 0.66 pull backs,
Also its BTC pair is testing a very strong support level,
Basically its great time to get a long position on spot as first entry.
Lets see
JASMYUSDT.PS trade ideas

JASMYUSDT UPCOMING!!Hi,
Hmm.... It's look like JASMY is forming a bullish cup and handle pattern on Daily Time frame. I think it's price gonna touch 0.01$. Next week would be bearish For JASMY cuz price should form the handle to complete the pattern.
Price has a support level at 0.6$ and 100MA is also proceeding towards this level to make it as a strong support. RSI is showing value above 70 So, it's also another factor showing us the price should have a correction before breakout. On Monday 24/04/2023 price could give a breakout. That's just my analysis always DYOR.
HAVE A GREAT DAY


Jasmy Diamonds diamond continuation/top/bottom patterns are rare and hard to spot, best used with other indicators or analysis tools etc.
when price breaks out of the diamond it can signal continuation of previous uptrend (or mark tops and bottoms). to measure the move take the high and low and you can take that distance from the break out as an estimated target, break out= entry, stop loss is the Higher Low (HL).
furthermore. it is vital to keep in mind that Diamond patterns are not always reliable, and traders should use other technical analysis tools in conjunction with the diamond pattern to confirm. and this is small time frame, highly volatile, crypto asset.


JASMYUSDT LONG#JASMYUSDT
I think that in the near future we will reach the price of 0.006982, where we may face resistance. If this range is broken, the next global resistance may be the price around 0.0085.
"Long" as long as we are above 200 ema (yellow line on the chart) and 20 ema (green line) on the Daily TF.

$JASMY/USDT 2D (#Bybit) Big falling wedge breakout & retestJasmyCoin finally regained 50MA support and downtrend seems over, let's swing long on demand zone, targeting 100EMA.
⚡️⚡️ #JASMY/USDT ⚡️⚡️
Exchanges: Binance Futures, ByBit USDT
Signal Type: Regular (Long)
Leverage: Isolated (1.0X)
Amount: 4.5%
Current Price:
0.004642
Entry Zone:
0.004420 - 0.003402
Take-Profit Targets:
1) 0.005969
2) 0.007519
3) 0.009069
Stop Targets:
1) 0.002189
Published By: @Zblaba
Risk/Reward= 1:1.2 | 1:2.1 | 1:3.0
Expected Proft= +52.6% | +92.3% | +131.9%
Possible Loss= -44.0%

JASMY about to break Major Trendline JASMY Is again Breaking Major Trend line Which was acting Major Resistance once Reclaim it And we are Good to Test 0.008$ Price Mark Again
Things looking Good for JASMY But
And Incase fail to Break it We can See JASMY Below 0.005$ again
So Good luck


Jasmy Breakout Jasmyusdt
Breakout Confirmed, Expecting 25-40% Bullish Move
Remember: We only give ldea's from our
experience and knowledge, it does not
mean that it will be 100% correct, the
market is always unpredictable, anything
can happen anytime.
Always trade with your own research and
knowledge. If You Are Satisfied With Our
Work Then Join.

Jasmy ShortSHORT Opportunity on Jasmy just before a 0.0064 resistance. I will be going in 2.5% @ 25x with a 1:1 profit target

JASMY USDTJASMY USDT buy long idea
confluence of AST + EWT + Harmonic + SMC
Sequence and conditions of AST completed.
I expect the price will go down on my entries for long as corrective waves of my EWT,
to complete leg D of bullish harmonic, take orders from order blocks.
I expect it will develop HBLD sequence on my blue fib levels
to reverse and push the price up.
details on chart.

JASMY SHOOOOOORT!Some level of overbuying
SQZMOM shows that it won't take too long to go into decline
I think it could be a good quick short.

JASMY 4 HOUR UPDATE ( TECHNICAL )For more updates, please follow my TradingView page, and if you find the content useful, kindly hit the "thumbs up" button to show your support. If you have any queries regarding trading, please feel free to send me a direct message on TradingView. Additionally, please share this content with your friends who may find it beneficial.
Please note that any trading updates provided here are for educational purposes only, and it is always advisable to conduct your own research before making any investment decisions. It is important to ensure that all conditions are met before following any trade plan suggested in this update.

JASMY CAN GO UPPER VERY SOONHi, dear traders. how are you ? Today we have a viewpoint to BUY/LONG the JASMY symbol.
For risk management, please don't forget stop loss and capital management
When we reach the first target, save some profit and then change the stop to entry
Comment if you have any questions
Thank You

JASMY - Further upside expected
Jasmy broke the wedge from my last post with an impulsive wave which is now being corrected.
Higher probability is for another leg to the upside, targeting 0.0057 resistance.
We also have 0.0046 just below which could provide a shield for long trades.

RLinda ! JASMYUSDT-> Attempt 1. Trend change phase JASMY breaks through the resistance of the descending range. Price updates the 1-week high and forms a retest. What to expect from the bulls?
The coin breaks through the 0.0049 level and forms a consolidation above the level. There is a chance of decline to the previously broken resistance line, but the fact that the price is in the trend change phase already allows us to look for areas to open the deal.
Consolidation above the level of 0.0049 opens us the potential for growth. The medium-term target is the resistance level 0.0058, the long-term target is the liquidity zone 0.0068
Regards R. Linda!

Jasmycoin Breaking descending Channel Breaking descending channel in h4 timeframe incase Of successful Breakout expecting 40 to 45% Bullish Move

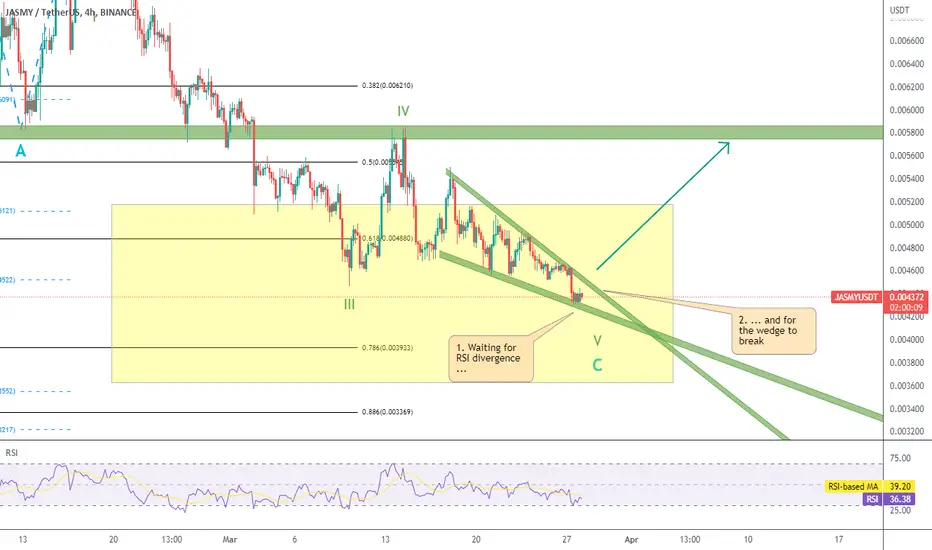
JASMY - Ending diagonal in playEven with prices falling since early February, I believe there is short-term hope for bulls.
Price is forming an ending diagonal (wedge formation), which in my primary count is wave V or wave C.
I'm waiting to see RSI divergence on the 4H chart, and a wedge breakout, for a long trade.
MOST MEN LIVE LIVES OF QUIET DESPERATION.We all know how price action works.
My message to you is look at the chart and see the patern.
We can see in this chart that there is volume and there is money in this coin.

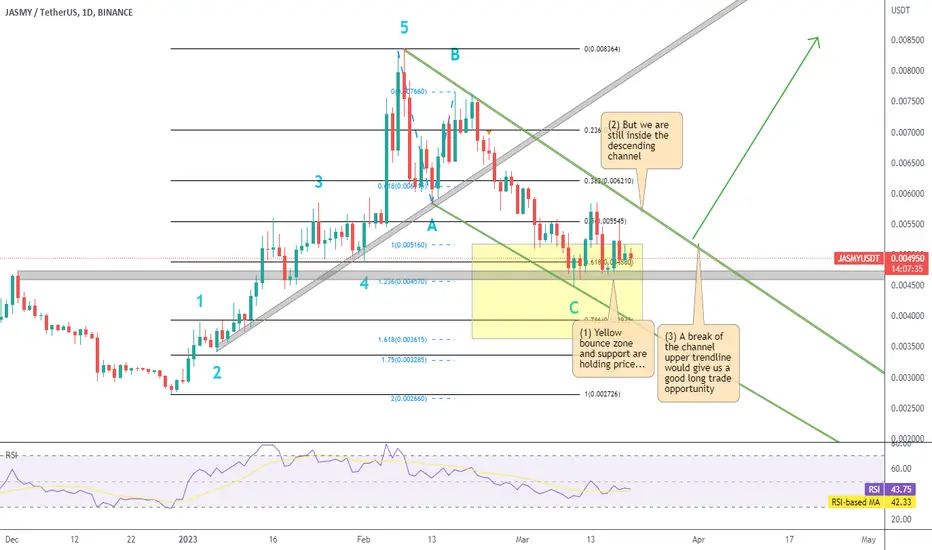
JASMY - Expected levels are holding price
JASMY price action has been sideways for the last 10 days, but I see the following key points to be noted:
Yellow Bounce Zone and Support: Price is being sustained by a yellow bounce zone and 0.0046 level acting as strong support. This prevents the price from falling further and provides a solid foundation.
Descending Channel: Despite the support, Jasmy remains inside a descending channel, indicating a prevailing bearish trend.
Break of the Upper Trendline: If the price manages to break through the upper trendline of the descending channel, it could signal a potential long trade opportunity, as the breakout might lead to a trend reversal or a significant upward move.
Jasmy Next ! stormy dayshi Jasmy can climb easily, I think if Bitcoin is green, maybe the first step is 0.01
