JASMY/USDT TRADE SETUP! A GOOD BUYING OPPORTUNITY!Hello everyone, if you like the idea, do not forget to support with a like and follow.
Welcome to this JASMT/USDT TRADE setup. JASMY looks promising here.
JASMY is breaking out from the bull flag-like structure and currently retesting it. It is holding an important support level (green box) so far. Expecting a good bounce from here. Buy some now and add more in dips.
Entry range:- $0.216-$0.232
Target:- 150-200%
SL:- $0.188
You can buy it on spot or use low leverage (2x-4x)
If you like this idea then do support it with like and follow.
Also, share your views in the comment section.
Thank You!
JASMYUSDT.PS trade ideas

JASMY USDTIts a Down Trend Crossing with Volume
I will Buy Here 0.026
My Ideas Are Not Financial Advice


UPDATE ON JASMY!!!I have posted signal about jasmy about week ago and it went up by 50%
Whats next?
Jasmy broke out of triangle so it hard that it will reach demand zone, but I dont fell good to enterat middle so I would advise you to wait for it to touch demand zone and go in other trades.
I say this because broken trendline can act as level of support but also doesnt have to.
Jasmy turned very bullish and is doing very good considering btc current dip.
I personally will trade other cryptos and if jasmy gets in demand zone I will long it but if it doesnt I didnt loose anything so its all good!

jasmyusdt maybeJasmy 1h chart has the formation of a bull flag. Looks like there's been a breakdown and a back test. Target $0.0385 usdt
is not investment advice.


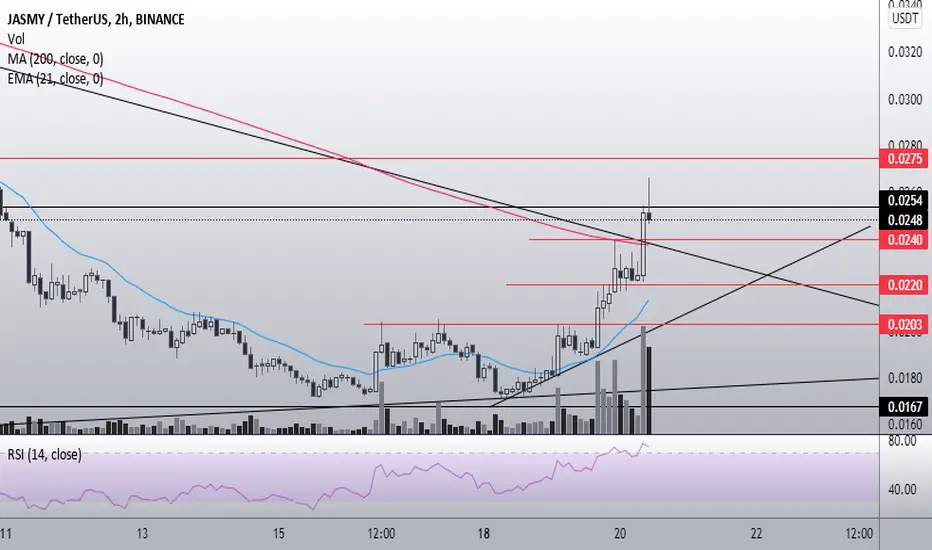
#JASMY/USDT This move will trigger 1100% + rally!JASMY has been in a downtrend since it got listed on the exchanges.
The CMP is around $.0244, almost 92%+ down from its ATH (As on Kucoin).
It's breaking out in LTF.
Break and close above this 170-day-long channel will trigger a massive rally.
It needs to pump almost 1100% + to reach its previous ATH.
I bought it on spot.
Best entry is $.021 to $.025
Short term target is around 50%+ whereas long-term target(In case we see a sharp fall in DXY) would be 500% to 1000%+.
A decent target would be at least 3x.
Let me know what you think.
Hit the like button and share your views in the comment section if you find it helpful.
Thank you
#PEACE

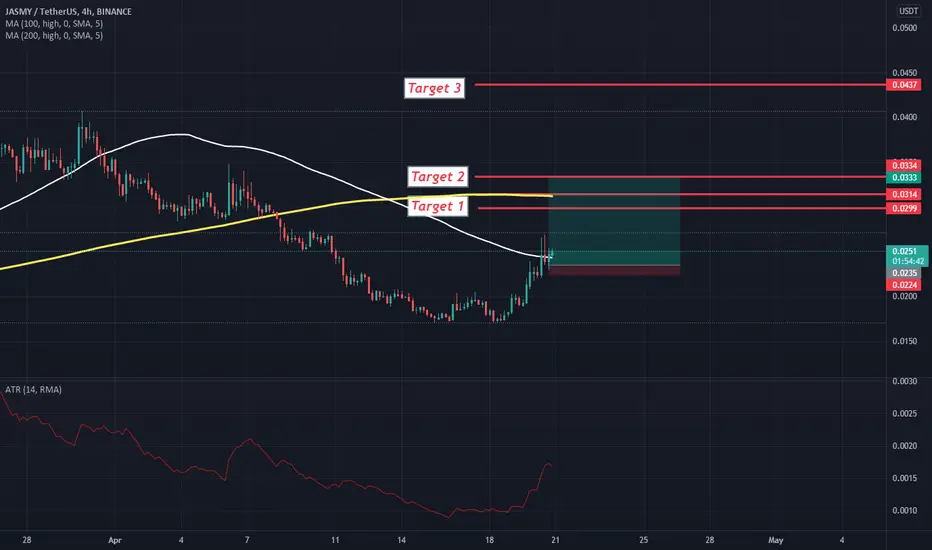
#JASMY BREAKOUT AND RETEST AND READY TO PUMP 350% !Hello, welcome to this JASMY/USDT 4hr chart update by CRYPTOSANDERS.
I have tried my best to bring the best possible outcome to this chart.
Show some support do hit the like button, follow and comment in the comment section. this motivates me to bring this kind of chart analysis on regular basis.
CHART ANALYSIS :
As we can see in the above-mentioned chart that JASMY just broke the channel pattern and currently moving down to retest so at the green zone or the upper trend line we can take a long position for almost 350% in the upcoming days.
Entry:- $0.0240,$0.0260
Traget:- 350%
Stoploss:- $0.02
Remember:-This is not a piece of financial advice. All investment made by me is at my own risk and I am held responsible for my own profit and losses. So, do your own research before investing in this trade.
Happy trading.
Sorry for my English it is not my native language.
Do hit the like button if you like it and share your charts in the comments section.
Thank you...

JASMY now doing AccumulationVolume more higher than previous high volume, but price can't go up.
I think price now doing Accumulation then make a more higher volume
What do you thinking about? Let me know at the comment. Thanks


We may see the JASMY coin in zones 0.31 DollerWe may see the JASMY coin in zones 0.31 Doller
to test the moving average
JASMY/USDT ways for tradeIntraday setup for purchase and sale of the EGLD asset. The transaction must be accompanied by a short stop, or the purchase should be made in parts at each of the levels.
The goals are minimal, you can carry some higher.

Jasmy Positive and respectful trend and its penetration leads to flight
TP1 : 0.0347
TP2 : 0.0411
TP3 : 0.0496
TP4 : 0.0619

JASMY bounces off the resistance at $ 0.02482Hello everyone, let's take a look at the JASMA to USDT chart on intervale 1 weekend. As you can see, price is moving above the local uptrend line.
Let's start with the designation of the support line and as you can see the first support in the near future is $ 0.01910, if the support breaks, the next one is $ 0.01073.
Now let's move from the resistance line, as you can see, the first resistance is $ 0.02482, if you manage to break it, the next resistance will be $ 0.02482, another one is $ 0.03340 and the next resistance is $ 0.03721.
Looking at the CHOP indicator, we can see that there is very little energy in the 1 weekend interval.

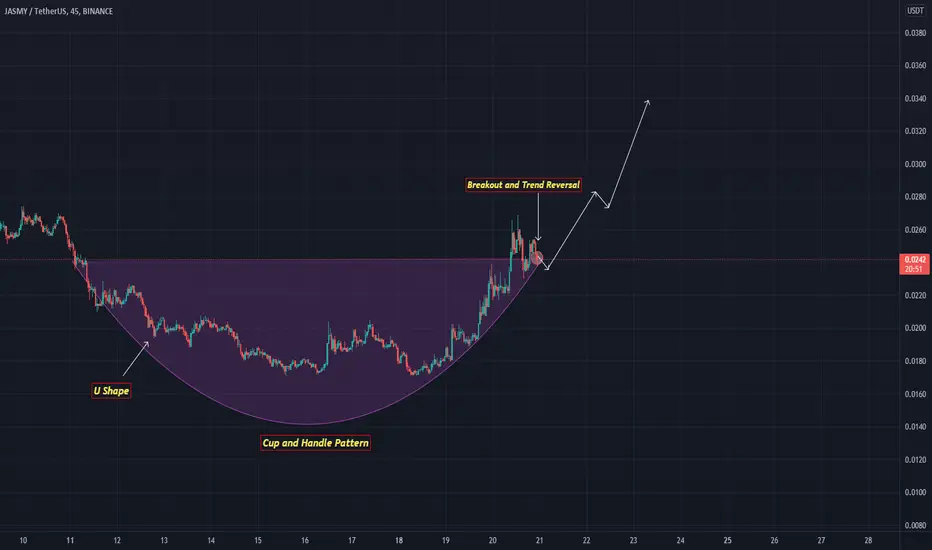
JASMYUSDTJASMY is about to break trendline at H4 TF. It is also forming cup and handle shape which makes it bullish.

T.A on Jasmy Double top PatternWe have an upcoming dip on jasmy according to this Double top pattern; which is a bearish pattern. i hope you can catch up to this signal and take your profits. Goodluck!! P.S. not a financial advice

+48% profit in 2 days ✅jasmy-usdt
buy : 0.0182 $
sell : 0.0254 $
profit : 42 % done
Congratulations to our team

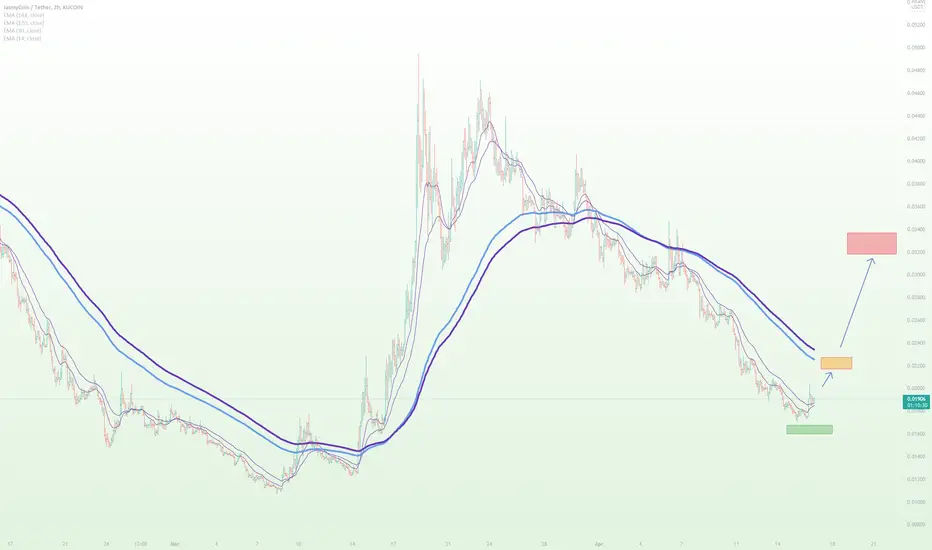
End of correctionAt this level I see an end of correction targets are on the graph, I will post the stop later.
JasMy possibilities Did saw the bottom and hype into it when everyone FOMO, that the game... Buy the fear and sell the greed!
Over 40% from entry @0.0175
Now currently, Jasmy about breaking the resistance @260, a possible break and close at @280...
We might see price moving to @322, which is the next resistance to contend with...
Generally volume looks pretty good, I see more upside.....
Pls, Not a financial advice....
Kindly DYoR...
If you like my content,
Kindly like comment and follow me to encourage more updates...
Thanks!

JASMY hit rock bottom! Potential long term uptrendIt is not a difficult task to draw a Fib Retracement on the daily chart and explore potential genesis understandings, specially on an asset that has a relatively short history.
Jasmy has clearly hit rock bottom, and now we know where we are and where we will never be again: 0.0100
At the current stage, we can consider a potential yet unclear double bottom. Daily chart is definitely bullish although I would suggest caution when trading Jasmy as Bitcoin does have more negative than positive effect on Jasmy trend lines.
Best trades are long term for maximum gains. Think quarterly at best.
In conclusion, JASMY is a long investment strategy at this point with significant opportunities for scalping.

$JASMY- Just Beginning to Fly NFA:
If you missed the bottom entry at .01,wait for the mini PB at those areas for re-entry because i believe $Jasmy is just starting(see Daily Time frame chart).
This is not a short trade so you have to be patient and wait to reap those resistance as profits.
Good Luck