Jasmy usdt analysis Jasmine coin
Pattern 2 bottom
Risk rewards ratio >1.5
First target 3
Second target 3.7
JASMYUSDT.PS trade ideas

Urgent Update on #JASMYUSDT: Is a Major Move Coming Ahead? Yello Paradisers! #JASMYUSDT is making some interesting moves after its breakout from a descending channel. Let's analyze #JASMY and find out what's next:
💎#JASMYUSDT has broken free from its longstanding descending channel, signaling a potential upward trajectory. After navigating within this channel for a considerable period, #JasmyCoin has successfully breached it and is now coming to retest its upper boundary.
💎The key resistance level at $0.0228 has now flipped into crucial support. This level is pivotal as it has been respected multiple times in the past. If #JASMYUSDT can maintain its momentum above $0.0228, there's a strong possibility of a sharp upward move.
💎However, the scenario changes drastically if the price falls below the $0.0228 support level. In this case, the focus shifts to the next support zone at $0.019 - $0.0205, where a bullish rebound could potentially occur.
💎While it might be tempting for some to short at this point, it's crucial to maintain a broader perspective and wait for confirmation from price action. A break below the $0.0192 support will likely trigger a significant downward move, leading to further price decline.
Be smart, Paradisers! The market rewards those who are prepared and stay focused on their long-term goals.
MyCryptoParadise
iFeel the success🌴

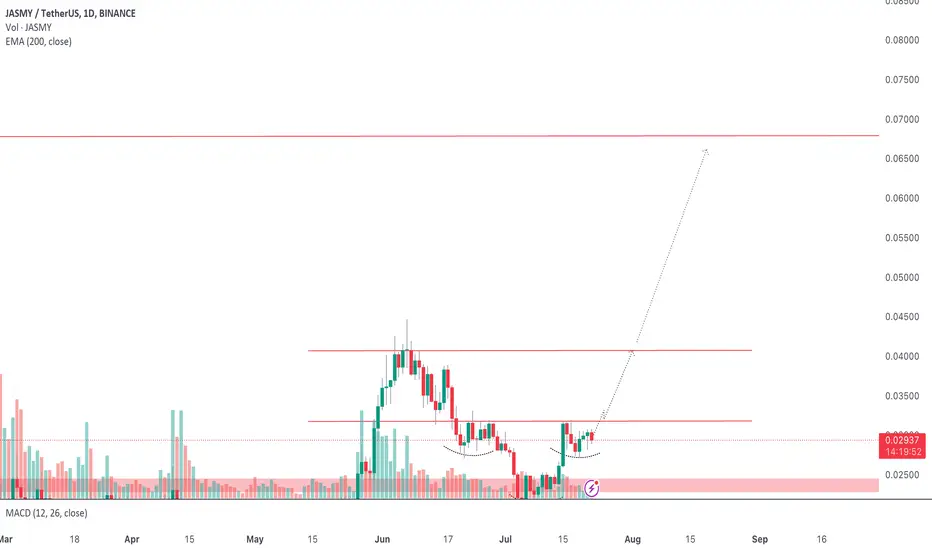
JASMY Update — Bullish Setup, 0.04 Stop-Over, 0.065 Next TargetLately, I've seen many posts and comments from people who were disappointed with JASMY's performance. "It's a shitcoin," "Will go to zero," "It'll never pump," etc. — these are just a few (and polite) examples of comments you can read.
I understand that people if they bought the top, are disappointed when a token dips like 50% (as JASMY did lately). However, overall, JASMY is doing super well and still has enormous potential from a chart and technical indicator point-of-view.
So, let's get some things straight:
➡️ Between January and June, JASMY pumped almost 800%. That's an incredible performance.
➡️ JASMY corrected sharply after each pump — which, by the way, is healthy.
➡️ Except for a few days, JASMY respected the overall support and resistance areas, and there hasn't been a risk of more downside potential or a bearish trend.
➡️ JASMY has been trading nicely above the EMA200 since the beginning of the year.
What's Next 👇
From my perspective, JASMY's chart looks quite bullish. Although it is not a playbook inverse head-and-shoulders pattern, we can clearly see a neckline (0.032) formed by two smaller and bigger dips. Additionally, the average volume has been constantly decreasing—exactly what you want to see in such a pattern.
In order for the pattern to play out, JASMY needs a strong volume influx, pushing it above the neckline. If this happens, we should quickly see it reconquering 0.04 as the next resistance.
In the mid-term, I stand with my prediction: 0.067 is the target!
$JASMY Forming A FlagAfter facing a fall from .044 levels we can see a flag setup forming backed up with a strong support level. Looking at the big picture a strong HSH pattern takes it place. Breakout of it would raise the price up back to its .044 level where we are faced with a strong resistance. Rejections might happen at that point but if the buyers hold strong we could see more gains reaching up to .06 levels.


Frankly, I don't feel like explaining, the chart says it all !!BINANCE:JASMYUSDT
broke out the bull flag on 2D timeframe
Up we go📈
Traders, if you liked this idea or have your opinion on it, write in the comments, We will be glad.
_ _ _ _ _ _ _ _ _ _ _ _ _ _ _ _ _ _ _ _ _ _ _ _ _ _ _ _ _ _ _ _ _
✅Thank you, and for more ideas, hit ❤️Like❤️ and 🌟Follow🌟!
⚠️Things can change...
The markets are always changing and even with all these signals, the market changes tend to be strong and fast!!

Jasmine Buylimit Price at Support of EMAs multi hi time frames. Brake of Structure accrued, we in retest mode if not fails. Always in practice proper reward over risk!

JASMYusdt, pullback and Buy!Price has bounced off every time it hits the resistance zone, forcing the candlestick to form a lower high. I expect the pull back to take out the FVGs in the area and the order block before making a major move to the resistance zone again.

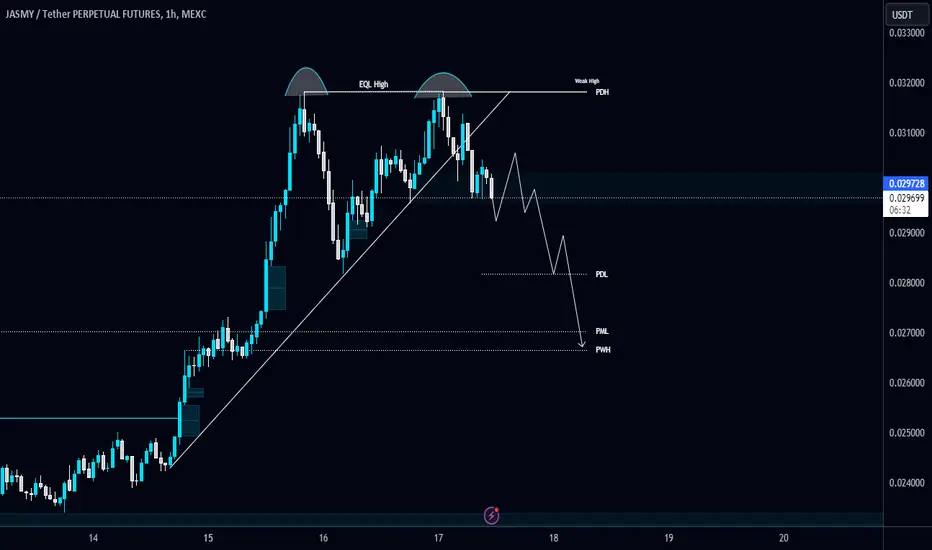
#JASMY/USDT formed a Double Top pattern and broke the Diagonal T#JASMY/USDT formed a Double Top pattern and broke the Diagonal Trendline in 1-Hour TF!
SEED_DONKEYDAN_MARKET_CAP:JASMY is looking heavy and looking for a Short position. The local support level is PML $0.02705 and the resistance level is $0.0318.
JASMYUSDT LONG SPOT TRADE SETUP!!Hello and welcome everyone to this Spot Trade setup!!
Again, I am here with the multi-bagger Alt JASMYUSDT. My previous trade setup on JASMYUSDT achieved all targets within a day or so, though it was a quick trade setup.
Click here to view the post-
So, let's discuss this chart. JASMYUSDT looks extremely bullish as it is forming an inverse head and shoulder pattern in 1D TF. A daily close above 0.005434 can trigger an upward rally in the upcoming days.
Entry:- CMP to 0.005434
TARGET 1:- 0.0083
TARGET 2:- 0.011065
TARGET 3:- 0.017407
SL:- Daily close below 0.005162
We hope you enjoyed this post. Please write for any query in the comments section below!
Safe Trading!!

#JASMY/USDT#JASMY
Our price is moving downwards on a 4-hour frame and is about to break through to the upside in 3 stages
We have a bounce from the lower border of the channel from the green support area at 0.02200
We have a tendency to stabilize above the Moving Average 100
We have an uptrend on the RSI indicator that is heading up
Entry price is 0.02350
The first target is 0.02600
The second target is 0.03000
The third goal is 0.03300

JASMY Bull-flag in weekly TFJASMY / USDT
many bullish signals are spotted in weekly TF
1- Bullflag pattern
2- bullish divergence
3- moving averages are holding
As long as this pattern is holding priority Looks bullish

JASMY/USDT TO 0.05 BUY NOW!!!!!!!!!!JASMYUSDT took out the buyside and price made a retest from the discount zone all am expecting from jasmy is price stability uptrend to the buyside till we grab liquidity for a selling opportunity
JOIN AND ENJOY
Tell us your views..................

JASMYUSDTmy entry on this trade idea is taken from a point of interest BELOW an inducement.. I extended my stoploss area to cover for the whole swing as price can target the liquidity there before going as i anticipate.. just a trade idea, not financial advise

JASMY IN BUY ZONE. R/R SWING LONG AND POSSIBLE LOCAL BOTTOM.I think JASMYs local bottom is in and it's ready to test higher. Good entries are at 4hr divergence zones, however I am already in for 200k jasmies at .024
Risk adverse TP is at .028-.029, in case this was a connector for lower. But honestly, who the hell is risk adverse and trades altcoins. I am looking for substantially bigger gains into the 2nd half of the year. She's got room to run..

JASMY/USDT SELL NOW!!!!!Jasmy created a rising wedge and we just experienced the third price rejections from the Buy side liquidity am watching out for price breakouts and retest to sell off to the sell side am going in on shorts from this zone till target 0.018 is completed
JOIN AND ENJOY
Tell us your take on this..........

JASMY LONG IDEAoverall marketing is green, looking at one hour mark there a area of buying and its been respected couple of time, and as you can see previous break of these are seller are full speed so they break it, but if you see the current price action, the seller are slowing down, and buyers are picking up speed, this is why i take a position, very tight spot, use low margin

JASMYUSDT.1DLooking at the JASMY/USDT chart, we can see a detailed technical analysis unfolding with various elements to consider:
Support and Resistance Levels:
Support Level (S1): At $0.01832, this is a critical level that JASMY must hold to avoid further downside. It's apparent from the chart that this level has provided support in the recent past.
Resistance Levels (R1, R2, R3, R4): R1 at $0.03071 is the first significant barrier that needs to be overcome for a bullish scenario. R2 at $0.03840 and R3 at $0.04469 mark higher peaks, which could indicate substantial price targets in a strong upward move. R4 is off the current screen but would be an ambitious long-term target.
Technical Indicators:
Relative Strength Index (RSI): The RSI is around 40, suggesting that JASMY is neither severely oversold nor overbought. This leaves room for movement in either direction, depending on market influences.
Moving Average Convergence Divergence (MACD): The MACD line is below the signal line, indicating bearish momentum. The negative histogram values further confirm this bearish sentiment, suggesting caution for buyers.
Given these insights, my current strategy would involve closely monitoring the $0.01832 support level. A consistent hold above this level may provide a buying opportunity, targeting a move towards R1 at $0.03071. Overcoming R1 would then shift focus to R2 and beyond, depending on volume and market sentiment.
However, the bearish MACD suggests that any positions taken should be managed cautiously with strict stop-loss orders to mitigate potential losses from unexpected downward movements. Additionally, it would be prudent to watch for any changes in the MACD and RSI indicators for early signals of a possible trend reversal or continuation of the current trend.
Investors should remain vigilant and flexible, ready to adapt to any sudden market changes that could affect the price dynamics of JASMY. As always, understanding the broader market context and any news affecting the crypto market or JASMY specifically will be crucial in timing these trading decisions effectively.

JASMY/USDT.Pam looking forward to long from the marked OB to sweep the upside liquidity only if btc looks stable with only 1% risk here.
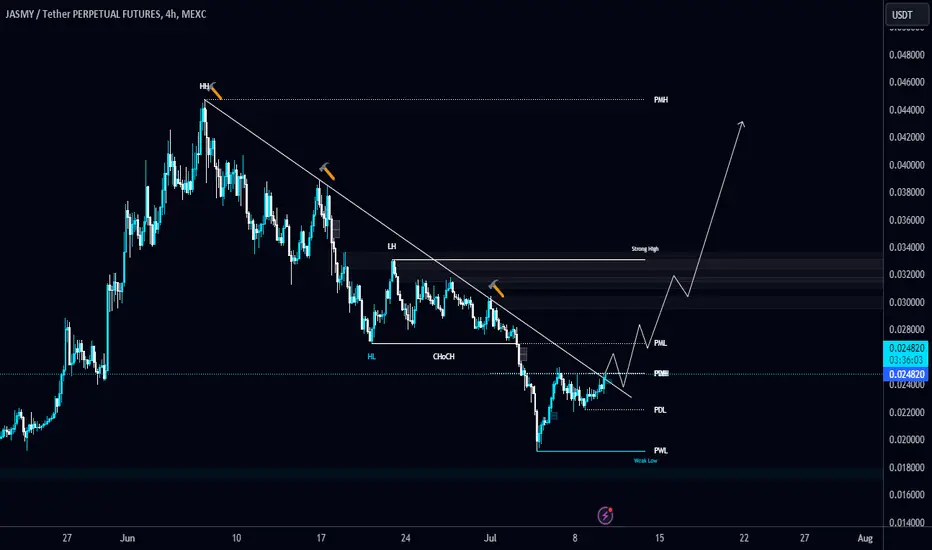
#JASMY/USDT breaking the Diagonal Trendline in 4-Hour TF!#JASMY/USDT breaking the Diagonal Trendline in 4-Hour TF!
Wait for BO/retest to long it. SEED_DONKEYDAN_MARKET_CAP:JASMY 's local resistance level is PML $0.0270, and the support level is PWL $0.01925.
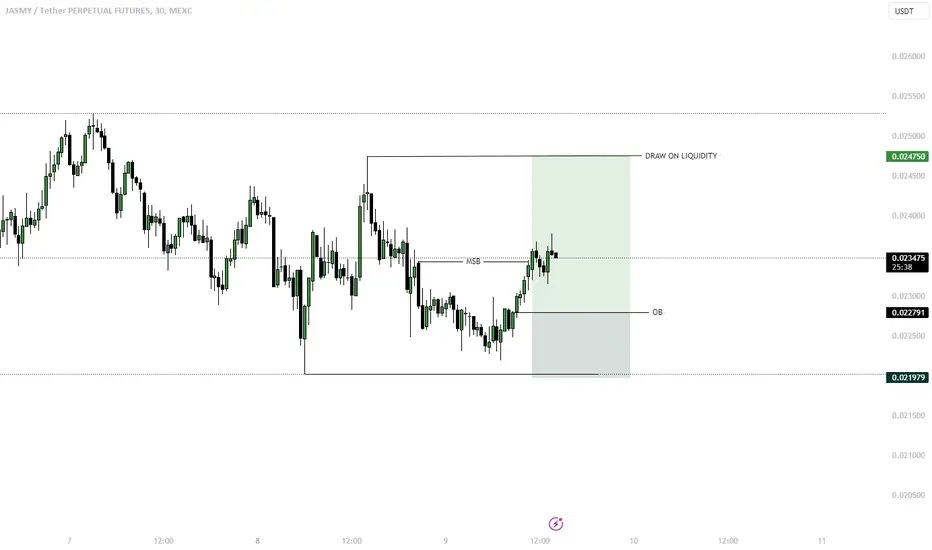
JASMY more downside po3Accumulation -> Manipulation - Distribution Setup
Not looking to buy any JASMY Coins right now.
The draw on liquidity looks like it wans to go lower.
I would only be interested in buying in the green box.

JASMY analysisAfter touching the price of 0.0444, JASMY has entered the correction and the JASMY structure has become bearish.
Considering the bearishness of the structure, the price is expected to drop to the lower range and then move towards the targets on the chart.
Closing a daily candle below the invalidation level will cause analysis.
We are looking for buy/long positions on the green range
Note that the financial market is risky, so:
Do not enter any position without confirmation and trigger.
Do not enter a position without setting a stop.
Do not enter a position without capital management.
When we reach the first TP, save some profit and try to move the stop continuously in the direction of your profit.
If you have any comments please post them, comments will help us improve our performance
Thanks

#JASMY/USDT is testing the Diagonal Trendline in Daily TF!#JASMY/USDT is testing the Diagonal Trendline in Daily TF!
There is a Daily FVG below its trendline. SEED_DONKEYDAN_MARKET_CAP:JASMY needs to hold this FVG and bounce back from here. The local resistance level is $0.02705.
