JASMYUSDT 1D#JASMY is breaking out above the symmetrical triangle resistance and the daily SMA100 on the chart.
If the daily candle closes above these levels, it could confirm a bullish breakout and potentially trigger a move toward the following targets:
🎯 $0.01729
🎯 $0.02011
🎯 $0.02290
🎯 $0.02689
🎯 $0.03197
⚠️ As always, use a tight stop-loss and apply proper risk management.
JASMYUSDT trade ideas

Buy Trade Strategy for JASMY: Betting on Data Privacy in IoTDescription:
This trading idea highlights JASMY, a cryptocurrency that combines blockchain technology with the Internet of Things (IoT) to give users full control over their personal data. As concerns around digital privacy continue to grow, JASMY positions itself as a key player by offering decentralized data storage solutions where users can securely manage and monetize their information. The project is backed by a team of former Sony executives, adding credibility and experience to its development roadmap. With Japan’s increasing support for Web3 innovation and IoT adoption, JASMY has strong long-term potential for growth.
Still, like all cryptocurrencies, JASMY is subject to high volatility and speculative interest. Market trends, global regulations, and investor sentiment can drastically influence its price. For this reason, investors should remain cautious and ensure proper risk management when trading.
Disclaimer:
This trading idea is for educational purposes only and does not constitute financial advice. Trading cryptocurrencies like JASMY involves substantial risk, including the possible loss of your entire capital. Always do your own research, evaluate your financial position, and consider speaking with a licensed advisor before making any investment decisions. Past performance does not guarantee future results.


JASMYUSDAS bitcoin taps into my sell supply zone 123-124k zone all other coins are reversing and jasmyusdt on sma+ema 4hr rejects

Live trade hello friends👋
Considering the fall that we had, you can see that the buyers supported the price at the support point and caused it to grow. Now with the return of the price and the construction of an upward pattern, you can see that we can enter into the transaction with capital and risk management and move to the specified goals with it.💰
🔥Join us for more signals🔥
*Trade safely with us*

JASMY to 0.036$ in March 2024?we now are having a major breakout of the major resistance that stands near 0.012$, having previously smashed through all the resistances after accumulation is done, we now after 600 days are in a zone of comfort bulls here.

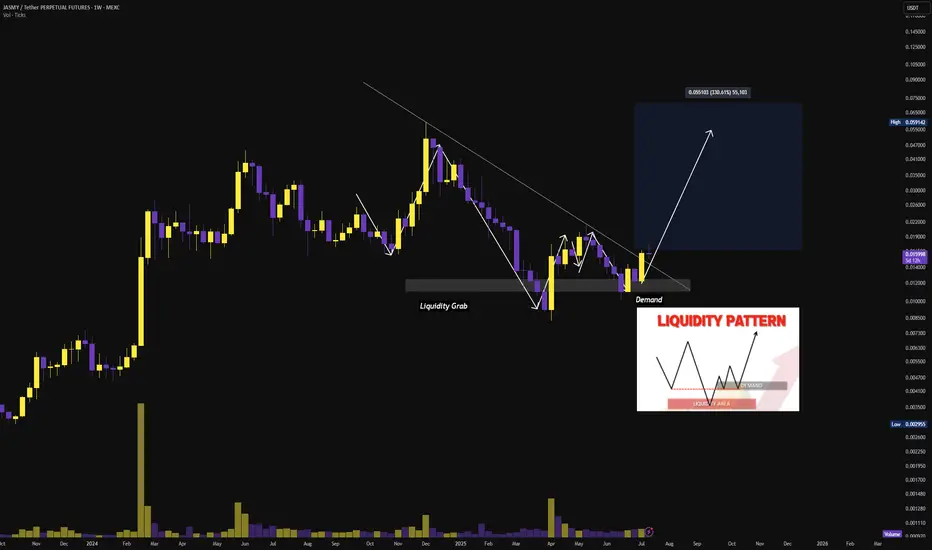
$JASMY | Weekly Bullish Reversal from Demand ZonePrice has completed a textbook liquidity grab below the established support range, followed by a reclaim of the demand zone and a breakout above the descending trendline. This move signals a potential shift in market structure on the weekly timeframe.
A successful retest of the breakout level could confirm the reversal and initiate a new bullish leg toward the 0.055 level — representing a potential upside of over 330%.
Key Confluences:
- Liquidity sweep at prior lows
- Break of structure (BOS) above LH
- Demand zone respected
- HTF trendline break
JASMYUSDT — Midterm Outlook | Buy & Sell Zones🚀 JASMY 2025-2026 Roadmap — What to Watch
Here’s my condensed view on SEED_DONKEYDAN_MARKET_CAP:JASMY for the next few quarters:
🔹 Q2 2025 (Jul–Sep)
Expect the alpha launch of the Jasmy App, first partnerships with local governments & sports teams, plus the big debut of JANCTION Mainnet L2, DEX and staking.
Could fuel a 20–40% rally on hype and fresh use-cases.
🔹 Q3 2025 (Oct–Dec)
Rollout of MyResume (HR-focused product), more JANCTION node sales and ecosystem build-out.
Should support a 10–20% steady appreciation if adoption shows up.
🔹 Q4 2025 – Q1 2026
Payments system to go live, aiming for 20,000 nodes, plus new banking & sports partnerships.
Could drive a 15–25% gradual climb into early 2026 if executed as planned.
💡 Bottom line:
This is shaping up as a multi-stage roadmap — short-term speculation in Q2, then more fundamentals in late 2025 to early 2026. If milestones hit and the broader market stays healthy, we might see a decent stair-step move higher.
🔥 Watching: JANCTION Mainnet deployment, real usage of MyResume, and partnership announcements.
👍 Like & drop your targets below if you’re tracking JASMY. 🚀 Let’s see how this plays out!

#JASMY/USDT GOOD TIME TO BUY JASMY I MARK THE TARGETS#JASMY
The price is moving within a descending channel on the 1-hour frame and is expected to break and continue upward.
We have a trend to stabilize above the 100 moving average once again.
We have a downtrend on the RSI indicator that supports the upward break.
We have a support area at the lower limit of the channel at 0.01213, acting as strong support from which the price can rebound.
We have a major support area in green that pushed the price upward at 0.01178.
Entry price: 0.01264.
First target: 0.01308.
Second target: 0.01367.
Third target: 0.01441.
To manage risk, don't forget stop loss and capital management.
When you reach the first target, save some profits and then change the stop order to an entry order.
For inquiries, please comment.
Thank you.

$Jasmy Possible falling wedge breakout This falling wedge pattern shows up in the 3day interval. The 4hr and other popular time intervals had bad news patterns on the hourly, an ascending wedge with downside breakout.
I guess we can wait and see ;)
thanks again,

JASMY/USDT – Golden Support Rebound Toward Explosive Targets!📌 Chart Explanation:
JASMY is showing strong potential for a bullish reversal from the key demand zone (highlighted in yellow) around the $0.01100–$0.01300 range. This zone has historically acted as a major support level since 2022, and it has just been successfully retested during the latest correction.
Following this bounce, price action indicates the beginning of a possible uptrend formation. If bullish momentum continues, we may see price reaching multiple resistance targets on the way up:
🎯 Upside Targets (Resistance Levels):
1. 🟡 $0.01704 – Minor resistance
2. 🟡 $0.02340 – Medium resistance
3. 🟡 $0.03969 – Previous major swing high
4. 🟡 $0.05712 – Psychological target
5. 🟡 $0.08716 – Mid-term target
✅ Bullish Signals:
Strong bounce from historical support implies possible accumulation.
Early signs of Higher Low formation.
Potential gain exceeding +500% if upper targets are achieved.
⚠️ Risk Note:
If the $0.01100 support fails, this bullish scenario becomes invalid.
Beware of fakeouts or potential bull traps.
🧠 Conclusion:
JASMY is setting up for a possible bull run from the golden support zone. As long as price stays above $0.01100, the mid-term outlook remains bullish.
#JASMY #JASMYUSDT #CryptoAnalysis #AltcoinSeason #BreakoutCrypto #BinanceAnalysis #TechnicalAnalysis #CryptoSignals #BullishSetup #SupportRebound

JASMY: Holds Potential for a 500% Rally!JASMY Update
JASMY is currently holding at the support level and is gradually moving upward, indicating a potential bullish trend. With the RSI steadily gaining momentum, there's a possibility of JASMY reaching gains of 400%–500% by Q4.
Strategy:
~ Accumulation Range: $0.009 to Current Market Price (CMP)
~ Trade Type: Spot
~ Holding Period: Q4 2025
Note: Always conduct your own analysis before investing.
Regards,
Dexter

JASMY/USDT – Potential Bullish Breakout Ahead?Hey traders! 👋
#JASMY is currently consolidating sideways on the 4H timeframe, right after completing a harmonic pattern – a strong technical signal often followed by a trend reversal or continuation.
🔍 What I’m Watching:
✅ Harmonic Pattern Completed: The recent price structure aligns well with a bullish harmonic setup.
🔄 Sideways Movement: Market is in accumulation, signaling potential energy buildup.
📈 Bullish Divergence forming on RSI/MACD (waiting for confirmation).
🚀 Key Resistance Level: If price breaks and retests this resistance, it could trigger a strong uptrend.
📌 Trade Plan:
We'll wait for confirmation:
Bullish divergence on 4H indicators.
Clean breakout and retest of the resistance zone.
Enter long with proper risk management (SL below recent swing low).
💡 Patience is key – no entry until confirmation.
💬 What do you think? Will #JASMY break out soon or continue ranging?
👇 Drop your thoughts in the comments!
❤️ Like if you find this helpful
📌 Follow for more clean setups and real-time updates!
#JASMY #CryptoTrading #HarmonicPattern #TechnicalAnalysis #BullishSetup #BreakoutTrade #Altcoins #TradingView #CryptoCommunity #TrendReversal #PriceAction #RiskManagement

JASMY 4H 17.06.2025Price BOS Low = more opportunities to sell > buy
2 high-probability demand zones
1. demand in 4H =0.0094-0.0115
2. demand in Week =0.0045-0.0074

JASMY Long Swing Setup – Oversold Bounce from Major SupportJASMY has seen a sharp decline in recent weeks, but price has now landed in a key support zone. With a potential bounce on the table, we’re eyeing the $0.015–$0.01355 range for a possible long entry toward resistance tests.
📌 Trade Setup:
• Entry Zone: $0.015 – $0.01355
• Take Profit Targets:
o 🥇 $0.020
o 🥈 $0.024
o 🥉 $0.030
• Stop Loss: Daily close below $0.013

Important support and resistance levels: 0.019249-0.024672
Hello, traders.
If you "Follow", you can always get the latest information quickly.
Have a nice day today.
-------------------------------------
(JASMYUSDT.P 1D chart)
It is showing signs of breaking away from the medium- to long-term downtrend line (1).
However, since it is located below the M-Signal indicator of the 1M chart, a short and quick response is required when trading.
It is expected that the price will start to rise if it rises above the important support and resistance area of 0.019249-0.024672 and maintains the price.
Even if it does not rise and falls, if the price is maintained above the downtrend line (1), it is expected that there will be an increase to eventually rise to the important support and resistance area.
The volatility period is around June 24, which is similar to the BTC volatility period, so it seems that it will have a big impact on the movement of BTC.
Since the HA-Low indicator of the 1D chart is formed at the 0.014447 point, if it is supported, it is an aggressive buying period.
-
Thank you for reading to the end.
I hope you have a successful transaction.
--------------------------------------------------
- This is an explanation of the big picture.
(3-year bull market, 1-year bear market pattern)
I will explain more details when the bear market starts.
------------------------------------------------------

#JASMY on monthly TF jasmy have to be one of best looking coin i have seen, range looks damn interesting, possible cup & handle also forming but for now if dip holds, the way i am expecting with ETH will ape with targeting range highs

JASMYUSDT 4D AnalysisJASMY ~ 4D Analysis
#JASMY Buy gradually after retesting this support block with a short term target of at least 15%+ from here.

#JASMY/USDT#JASMY
The price is moving within a descending channel on the 1-hour frame, adhering well to it, and is heading towards a strong breakout and retest.
We are experiencing a rebound from the lower boundary of the descending channel. This support is at 0.01480.
We are experiencing a downtrend on the RSI indicator, which is about to break and retest, supporting the upward trend.
We are in a trend of consolidation above the 100 moving average.
Entry price: 0.01530
First target: 0.01593
Second target: 0.01650
Third target: 0.01720

jasmy/usdtWe're looking to go long on JASMY/USDT as it's approaching the 0.1550 Fibonacci level, which aligns with key dates identified through Gann analysis. This level is likely to act as a magnet for price action or serve as a potential reversal point.
In addition to the Fibonacci confluence, we’re watching a descending trendline that has been guiding the recent downtrend. Our trade entry will be based on a confirmed breakout of this trendline, which would signal a shift in momentum and support our bullish bias.
This setup combines time-based analysis (Gann), price levels (Fibonacci), and structure (trendline breakout), giving us a high-probability trade opportunity. As always, manage risk properly and wait for confirmation before entering.

Will #JASMY Retest Trigger a Rebound or a Breakdown? Key LevelsYello Paradisers! Have you prepared yourself for what’s about to unfold with #JASMYUSDT? The #JasmyCoin setup is showing signs of a major move:
💎#JASMYUSD has just completed an impulsive move from the Major Demand Zone around 0.01509 and is currently retesting the ascending support after breaking down from the short-term channel. This is the critical moment where disciplined traders prepare their next move, not after the bounce, but before it.
💎What we’re seeing now is a textbook retest of the ascending support, after an aggressive move from the major demand zone. The price is currently hovering just above the 0.01742 support level, a critical area that aligns with the high-volume node from the visible range volume Profile (VRVP), making this a high-probability reaction zone.
💎If the #JASMY price holds here, and we start seeing buyer strength reclaim the broken ascending channel, this could trigger a sharp bounce targeting the mid-term resistance at 0.02221. Above that, the next magnet will be the major resistance sitting around 0.02512, a level likely to attract profit-taking or even large-scale short entries from smart money.
💎However, failure to hold this support and a confirmed breakdown below the 0.01509 zone would invalidate the bullish structure entirely. In that case, we would be looking for a possible bearish continuation, driving the price toward 0.01400 and possibly lower, where more liquidity pockets remain untapped. That move would also trap late long entries and clean out weak hands — the exact kind of shakeout we warn about.
Play it safe, respect the structure, and let the market come to you!
MyCryptoParadise
iFeel the success🌴

GOOD TIME TO BUY JASMY I MARK THE TARGETSHello, the best opportunities are coming, don't forget it's not investment advice, but do your search for your best answer, greetings RAP
