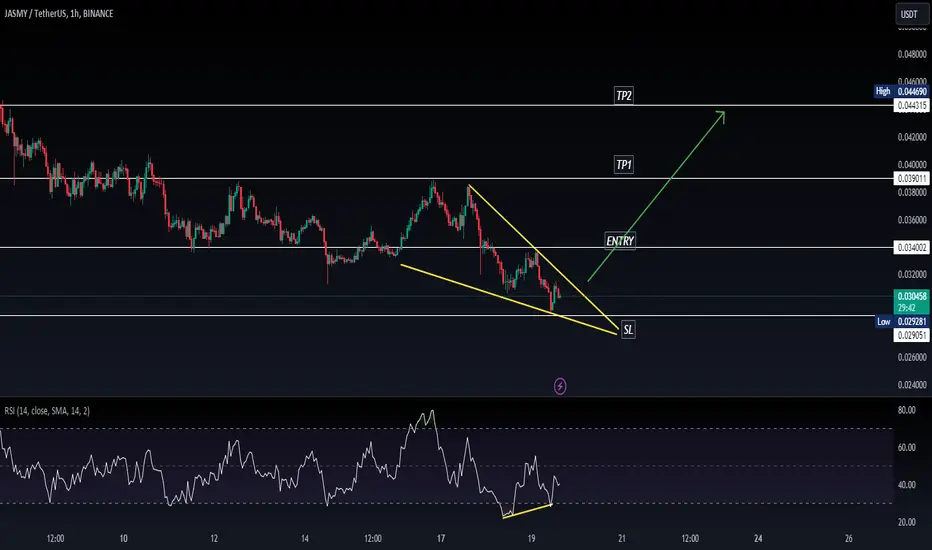
JASMYUSDT bullish movement is about to happen!!!BINANCE:JASMYUSDT
As you can see, the price made a good climb after breaking the triangle, and after that, it started its downward phase and now it is close to the most important Fibonacci level, which after reaching it, the price can react.
Traders, if you liked this idea or have your opinion on it, write in the comments, We will be glad.
_ _ _ _ __ _ _ _ _ _ _ _ _ _ _ _ _ _ _ _ _ _ _ _ _ _ _ _ _ _ _ _
✅Thank you, and for more ideas, hit ❤️Like❤️ and 🌟Follow🌟!
⚠️Things can change...
The markets are always changing and even with all these signals, the market changes tend to be strong and fast!!
JASMYUSDT trade ideas

JASMY CAUTION JASMYWell Well Well look what we have here on the weekly. This does not look good at all. I just want to say LOOK OUT BELOW, those long term holder will feel some pain. Weekly chart on Jasmy shows a bear div on yalahari B with a red dot on momentum, vwap dipping with a vwap div. That move to above 4cents trapped longs. I see a move to 2 fib golden pocket areas. on the move down all vector zones will be cleared and momentum should pull us into the golden pocket fibs. this is not looking good. but good, for the short.

JASMYUSDT: Bullish TrendIn my previous analysis JASMY is formed H&S Pattern and moved in bearish trend, Now JASMY is forming LLs and LHs, but on the 1hr time frame there is a strong bullish divergence, if JASMY break the previous LHs so that is a bullish sign and we can take a new long trade on the break of the LHs.

JASMYUSDT: Bearish Trend (H&S Pattern) JASMYUSDT is moving in down trend and currently formed perfect Head & Shoulder Pattern on 4hr time frame, and also break the nick line and previous LLs that is confirmation of the bearish trend so we can take a short entry on current market price or mention entry price in the chart.


JASMYUSDTJASMYUSDT is in reversal mode.
Bullish divergence also shown in RSI.
We wait and watch for the breakout of last LH.
JASMYUSDT BUY NOW!!!!!!!!!!!!!!!!!!!JASMY Completed my last analysis predictions now price just sweep liquidity at my fvg zone am expecting a quick recovery to the buy side for a breakouts in the price of jasmy coin
Am currently on long from this point
JOIN AND ENJOY...............

#JASMYUSDT #4h (Binance Futures) Descending channel breakoutJasmyCoin formed a bull flag and is pulling back to 100EMA support, looks good for bullish continuation especially after that previous hammer.
⚡️⚡️ #JASMY/USDT ⚡️⚡️
Exchanges: Binance Futures
Signal Type: Regular (Long)
Leverage: Isolated (3.0X)
Amount: 6.1%
Current Price:
0.035194
Entry Targets:
1) 0.035153
Take-Profit Targets:
1) 0.046679
Stop Targets:
1) 0.029376
Published By: @Zblaba
CRYPTOCAP:JASMY BINANCE:JASMYUSDT.P #JasmyCoin #IoT jasmy.co.jp
Risk/Reward= 1:2.0
Expected Profit= +98.4%
Possible Loss= -49.3%
Estimated Gaintime= 1 week

Daily Bear Div, JasmyBear Div On the Daily, Jasmy Token! Money Flow is Down, Vwap is low and Momentum is down. I have two Take Profits areas using golden pocket fib. Long term play, If BTc falls this will play very nice! time will tell

JASMY DAILY DEADLY BLOOD DIAMOND 1DAYNow this would be the ultimate short right here. 3TPs all ready and set. This will be an epic short thats for sure. I see a blood diamond on the one day. There is a huge bear div on momentum+money flow is down+rsi and Stochrsi about to drop below the 70 line. I see price moving into all fibs and clearing all vector zones on the way down. SUPER BEARISH! THIS IS A MUST WATCH

JASMY Falling WedgeThis wedge looks pretty solid, wouldn't be surprised to see JASMY continue to break lower

JASMY Local Re-DistributionThis is a local re-distribution on Jasmy after the initial rejection from the 2 week supply.
I'm expecting it to continue down from here.
Targets / Ideal re-entry points are: $0.0153 / $0.00794 / $0.00545 / $0.0041 / $0.00324

JASMY USD LONG READY TO FLY TARGET 0.03500JASMY USDT RISE READY INVESTMENT
Long 0.018877
Tp1 0.02525
Tp2 0.03500
tp3 0.03900
Stop 0.012693


Jasmy Price predictionDear Traders,
i see jasmy on weekly going up to theese targets but from now to 1 week it may dump to 18 20 where it was before

JASMYUSDT BUY NOW 0.044 SOON!!!!!!!!!!!!!JASMY completed three targets from my sell entry now we got a breakouts from the buy side of the falling wedge am waiting for the retest for a buys because price is heading to sweep or run liquidity above 0.044
TELL US YOUR VIEWS ON JASMY

jasmy short setupjasmy short setup. We can see change of character here. so we will see drop to the previous buy order block.

JASMY ANALYSIS🔮As we said earlier, #JASMY performed same. Around 113% movement after we post our analysis.
Now we can see that there is a formation of "Falling Wedge Pattern" in #JASMY. Also there is a perfect breakout 👌 We will see a bullish move of around 20% in few days
#DYOR

Jasmy 4HR BLOOD Diamond. Does it Print?A 4HR blood Diamond is trying to print for Jasmy. If this diamond can print, I'm looking for movement to the downside, clearing vector zone and hitting the golden pocket fib

JASMSY SHORT GOING VERY WELL jasmy trade setup perfect short open . those who open short congratulations u are in big profit right now . every one saying that jasmy going to moon . u can check my comments about that .

JASMY short setup ALL trading ideas have entry point + stop loss + take profit + Risk level.
hello Traders, here is the full analysis for this pair, let me know in the comment section below if you have any questions, the entry will be taken only if all rules of the strategies will be satisfied. I suggest you keep this pair on your watchlist and see if the rules of your strategy are satisfied. Please also refer to the Important Risk Notice linked below.
Disclaimer

JASMY's Situation: What Shall we ExpectHi.
BINANCE:JASMYUSDT
As you can see, the price is in the ascending channel and has reached the ceiling of the channel and now we are correcting the price to the PRZ zone, then the price can grow well.
❗ Note that if the Triangle is broken down with the power of descending candles, our analysis will fail.
Traders, if you liked this idea or have your opinion on it, write in the comments, We will be glad.
Previous Analysis
_ _ _ _ __ _ _ _ _ _ _ _ _ _ _ _ _ _ _ _ _ _ _ _ _ _ _ _ _ _ _ _
✅Thank you, and for more ideas, hit ❤️Like❤️ and 🌟Follow🌟!
⚠️Things can change...
The markets are always changing and even with all these signals, the market changes tend to be strong and fast!!

JASMYUSDTAccording to the labeling that has been done and if it is correct, we can expect the start of an upward rally in the form of wave 5 of 3.. Spot buying around $0.0324 can be associated with less risk.
