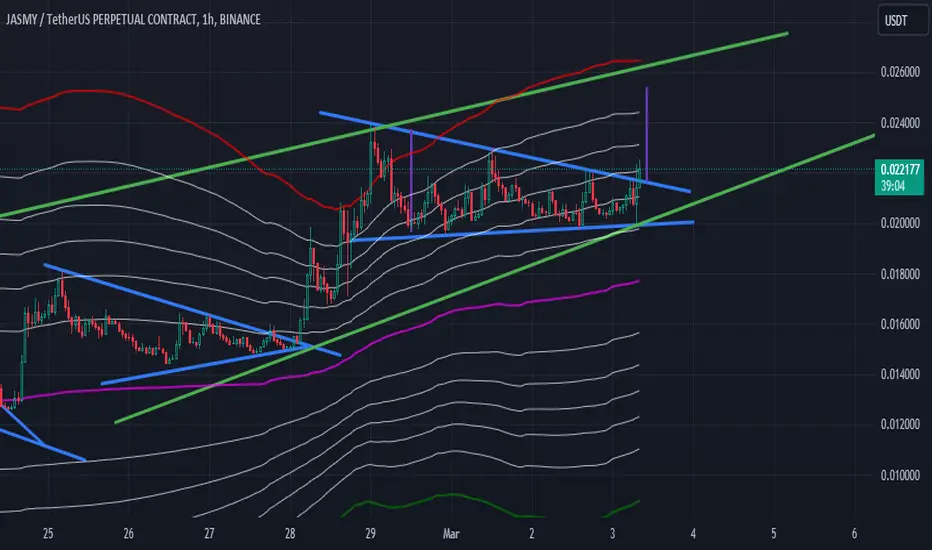
JASMY - 4hrs ( Pump 40 % Target After Break 0.0211 ) Dont miss Target Pump 40 % in Fast Run After Break
0.0211 Level - Dont miss the chance
JASMYUSDT trade ideas

Jasmy Wave 5 will be gloriousJasmy consolidating nicely at $0.02.
Scam wick to 0.015 took out a lot of leveraged longs.
Stay in spots.
Buy dips.

JASMY long term double bottom about to break outJasmy sufferred some serious diluation in 2022-2023. 10% circulatio supply increase to 99% circulation suppply. The tokens is now fully diluted.
Double bottomed.
If there is a crypto bull run in 2024 Jasmy has a great setup for for bullish strucutre.

Jasmy short ideaI've been watching jasmy for a couple weeks now. Breaking out and reaching its high of 0.028. It has presented a head and shoulder pattern: if it breaks the 0.020 again there will be draw down to liquidity below. Once we regain liquidity from below get ready for a retest of its recent high.
If head and shoulder is false, then we will see a next leg up in this uptrend. Not financial advice, just my analysis.
- CryptoJay

JASMYUSDT is BullishJASMY is currently looking good as it has broke the previous lower high and printed a new higher high followed by a higher low. The bullish momentum would take the price to print new highs. Targets are mentioned on the chart.

LONG STORY SHORT...Here are the main idea you need to keep in mind for Jasmy. I'm optimistic for long term holding but for short term trading I advice being careful. Not a financial advice.

Finally out of the corridor !! and still in the ascending trendTomorrow should be a positiv day for jasmy. Of course stay tunned and avoid leverage to not be liquidated and lost all your money. not a Financial advice

Descending parallel channel confirmed, to decision is coming(Short term) The channel was confirmed and the music partition will go soon to the next chapiter. Will it be a sad or happy melody ? The answer is coming soon... (Not a financial advice)

(short term) let the music play but continue to listen !(not a financial advice) We are going through a descending parallele channel which needed to be monitored to see if a correction is incoming or the continuation of the up trend until the next resistance around the red line fib

JASMY → still running!hello guys...
as you can see this coin break an ascending channel and touched the next level!
the last move was a sharp one and we can expect the next upward movement start from the blue area!
the next target is 0.028399
___________________________
💻📞☎️ always do your research.
💌📫📃 If you have any questions, you can write them in the comments below, and I will answer them.
📊📌❤️And please don't forget to support this idea with your likes and comment


Jasmy short term positions long into an ascending triangle Not a financial advice, showing a way to take a short term position LONG and an ascending triangle need to be monitored if it brokes up or down
Descending triangle became horizontal parallel channel pattern(Short term) Descending triangle became an horizontal parallel channel pattern to monitor for breakout !
Not a financial advice

Areas to retestThis coin has been manipulated by a sole trader using around 10 million USD to create order blocks in both directions to sustain price ranges, Price has also been propped with leverage trades. I expect liquidity to eventually seep out of this coin into other projects for pumps. Dont believe the hype.

15m JASMY Squeeze into Breakout Daily and 4H trend continues to be upward.
A triangle is forming as a squeeze on 15m. Placed an entry at the bottom of the 1H support that coincides with the diagonal support as well as the 200MA. Stochastic also was in oversold region with a hook up into the blue zone as a potential sign of changing momentum. MACD cross also validates this hypothesis.
After entry there had been a false break/wick at the upper diagonal resistance. I’m expecting the wick as a sign of shorts’ stop losses being liquidated or triggered. This signals more potential up move after an expected follow up retracement.
Volume continues to be slow but the patterns seem to support an upward move after the squeeze and bounce off support as part of normal retracement.

JASMY 25-50% Long 15m TFUsing the daily support and the descending triangle channel, we can do a small long but high margin trade upon more confirmations - eg close of bullish candle at the support.

JASMY WATCH: SIGNS OF A POTENTIAL UPTREND SHIFT ON THE HORIZONIn our latest technical analysis of the JASMY coin, we've observed several key indicators that suggest a possible shift towards an uptrend in the short-term timeframes. After closely examining price movements and market dynamics, our predictive model is signalling a bullish sentiment on the horizon. As a result, we are entering a strategic point of $0.020, with a stop loss set at $0.018 to manage risk effectively. Our analysis aims for a take-profit level of $0.0235, anticipating a favorable uptick as market conditions align. This potential shift is backed by a comprehensive review of volume analysis, pattern recognition, and momentum indicators, which collectively indicate a growing buying interest and potential for price appreciation. Investors and traders are encouraged to monitor these levels closely, as the anticipated movement presents a promising opportunity for those looking to capitalize on JASMY's evolving market dynamics.

JASMYUSDT RİSİNG WEDGE??!!
After triangle breakdown, what will JASMY do now?, which is sailing in the rising channel
Traders can adjust risk managament and enter long from the current price

Falling wedge pattern is complete !!!! According to the chart falling wedge pattern is complete and i think it will return. But trade with your own idea.

jasmy is performing an **Ascending Broadening Wedge pattern**hi jasmy is performing an **Ascending Broadening Wedge pattern** i think it will return from 0.01900 or 0.01600 if first target is break

JASMYUSDTmy entry on this trade idea is taken from a point of interest ABOVE an inducement.. I extended my stoploss area to cover for the whole swing as price can target the liquidity there before going as i anticipate.. just a trade idea, not financial advise

Jasmy Ready Again after Successfull Buy Trade## Jasmy Coin (JASMY): Short Fundamentals, Recent News, and Disclaimer
**Fundamentals:**
* **Jasmy Coin (JASMY):** Aims to be a data-driven platform for the Internet of Things (IoT) that empowers users to control their data.
* **Launched:** October 2021.
* **Market Cap:** ~$43 million (as of Feb 23, 2024).
* **Rank:** #778 on CoinGecko.
* **Unique Features:**
* **Focuses on data ownership and control for users.**
* **Utilizes blockchain technology to create a secure and transparent data marketplace.**
* **Partnerships with major Japanese companies like Panasonic and VAIO.**
**Recent News:**
* **Feb 22, 2024:** Jasmy announces strategic partnership with blockchain security firm AnChain.AI.
* **Feb 15, 2024:** Jasmy releases whitepaper outlining its vision for a "data democracy" powered by blockchain.
* **Jan 31, 2024:** Jasmy announces integration with MetaMask Institutional, a cryptocurrency wallet solution for institutional investors.
**Disclaimer:**
* This information is for educational purposes only and should not be considered financial advice.
* Cryptocurrency investments are highly volatile and carry significant risks.
* Do your own research before making any investment decisions.
**Additional Notes:**
* Jasmy Coin is a relatively new project with limited market adoption.
* The recent news items highlight Jasmy's focus on partnerships and development.
* It's crucial to understand the risks involved in cryptocurrency investments before making any decisions.
I hope this information is helpful! Please let me know if you have any other questions.

Jasmy will fall to 0.015500 if 0.017 resistance is break !!!!! I think jasmy will return from 0.015500 .daily line will returned it.
