JASMY bouncing up from a daily demand zone The Daily time frame shows strong demand zone to act as a strong support.
Being confirming this it is highly likely that it will go up.
Make sure to get the details in the lower time frames for any potential entry, if you are planning to take this trade.
ALWAYS EXERCISE PROPER RISK MANAGEMENT BY PUTTING STOP LOSS
Let's see how it will go.
JASMYUSDT trade ideas

short positionwe recive to a daily base and have CHOCH and exit of the wedge
when the price pullback to break even we can get a short postion

BUY JASMY/USDT NOW!!!!Looking at JASMY its moving towards the main resistance zone am buying from this point and holding up to 0.007 target join now....


buy positionthe TR is break and comlete the pullback and comlete second leg and we can get it for good buy position

Jasmy NEXT possible move here I will explain everything in Chart so please check out and also follow me


JasmyUsdt ShortThis pair broke through the trend line and came back to touch it from below, looking at the rsi and macd, one can see that it has also lost momentum. look to short the pair where possible.

another trade on JASMY {hight risk} These trades reflect my trading history
Trades will be updated on the same published chart such as Take Profit, Early Exit or Partial Exit.....
STOP LOSS 24H CLOSE

JASMYUSDT - 2 possible scenariosPrice has currently entered into a trading zone which we could try to predict 2 sides according to that it does in the next days or week.
Key zone we are analyzing here: 0.0046 - 0.0042
Bullish if:
Support holds and after a double bottom or inverse h&s, we get confirmation of a breakout from the pattern then we can go long.
Bearish if:
Breaks down the zone then it would go down to the next area which is 0.0034 - 0.0037
Please manage risk accordingly. I'll be updating and following this coin ♥

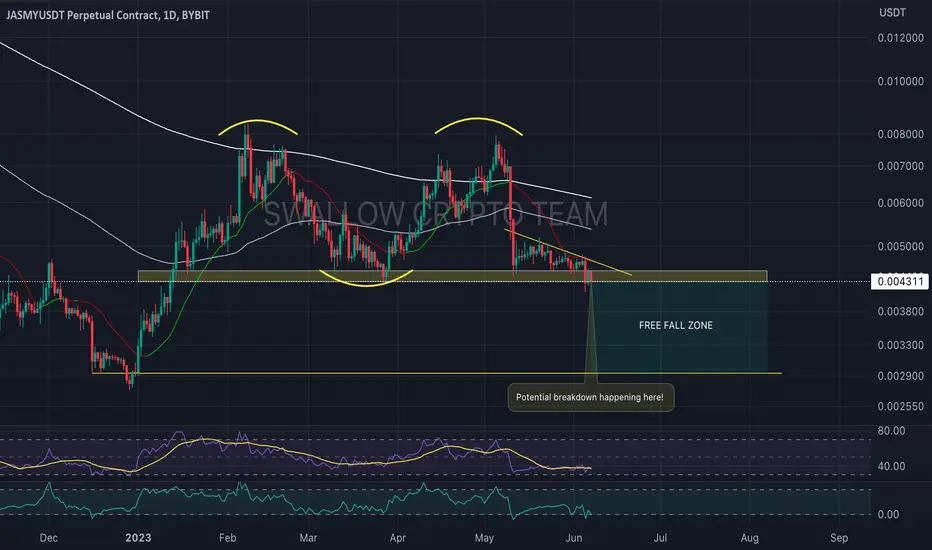
JASMY/USDT seems to be breaking downHey traders 👋
We will be keeping it short here, we see a good potential for a breakdown to happen on JASMY. Re-test has happened and now we need that last conformational breakdown!
If you like ideas provided by our team you can show us your support by liking and commenting.
Yours Sincerely,
Swallow Team
Disclamer:
We are not financial advisors. The content that we share on this website are for educational purposes and are our own personal opinions.
based on volume analysis this is agem buy jsamy usdtaccording to my analysis this token is highly profitable on long term buy with alittle money here and you will become rich in few months may be 10 month or less

JASMYUSDT a new trade idea on jasmyusdt (previous one ignored entry).. buying from the demand zone below the inducement.. see pics for details

jasmy coin :) Jasmy getting it in! bullish currently and rising but today with Bitcoin undecided it'll most likely be a very slow rise but it's good to see regardless after some previous drama ... good for them keep rising :)

JASMY LOOKS BULLISHHi, dear traders. how are you ? Today we have a viewpoint to BUY/LONG the JASMY symbol.
For risk management, please don't forget stop loss and capital management
When we reach the first target, save some profit and then change the stop to entry
Comment if you have any questions
Thank You

JasmyUsdt LongThis pair broke through the trendline and came back to touch it from above,it rejected closing below it and it bounced of the 50 day MA,and the market sentiment is risk on.

Swing Long OpportunityWe are currently on high timeframe support zone and the weekly and monthly charts are bullish.
The price is currently on support and is holding very strong.
What i think is if this support zone held then we are for sure breaking the HTF trend and can go very very higher on this one, thus it makes a swing trade here.
DCAing in the marked area and holding for long time.
Will close if price holds below 0.0035
RR on this one is too good. Just required patience.
Note: Not a financial Advice.
Follow me here for more as i am posting often here on TView.


JASMYUSDT.P Descending Channel BreakoutJASMY is following a descending channel on multiple smaller timeframes, 10min, 15min. etc. At the close of the first candle above the top trend line we entered our long trade and placed a tight stop below the wick of the previous breakout candle. Take profit is calculated by taking the length of our channel and placing it at our entry price or experiment with placing it at the start of the channel. Stop loss is adjusted as price rises to lock in gains.

JasmyCoin (JASMY) formed bullish Shark for upto 45% moveHi dear friends, hope you are well and welcome to the new update on JasmyCoin (JASMY) Token.
On a daily time frame, JASMY has formed a bullish Shark pattern for the bullish price reversal.
Note: Above idea is for educational purpose only. It is advised to diversify and strictly follow the stop loss, and don't get stuck with trade

Jasmy Latest Update Jasmyusdt
Jasmy loosing big support on daily time-frame incase of breakdown 20-30% Drop expected
Jasmy needs to bounce back from here to remain bullish
Dyor

JASMY CAN MAKE A DROPHi, dear traders. how are you ? Today we have a viewpoint to SELL/SHORT the JASMY symbol.
For risk management, please don't forget stop loss and capital management
When we reach the first target, save some profit and then change the stop to entry
Comment if you have any questions
Thank You
