JOEUSDT 1D#JOE is moving inside a symmetrical triangle on the daily chart and has bounced nicely off the triangle support.
📌 In case of a breakout above the triangle resistance and the daily SMA100, the potential upside targets are:
🎯 $0.2005
🎯 $0.2478
🎯 $0.2861
🎯 $0.3244
🎯 $0.3789
🎯 $0.4483
⚠️ As always,
Related pairs

JOE/USDT Approaching a Major Turning Point: Will Buyers Step In?🔎 Market Overview & Structure:
JOE/USDT is currently trading within a major historical demand zone between $0.1241 – $0.1548, a level that has proven to be a strong support since early 2023. Each time the price revisits this area, we’ve seen significant bounces — indicating that buyers continue to

JOEUSDT 5D AnalysisJOE ~ 5D Analysis
#JOE Buy back from here. This is the lowest support block for now, Short term target 20%+, Long term target $0.5 - $1.4

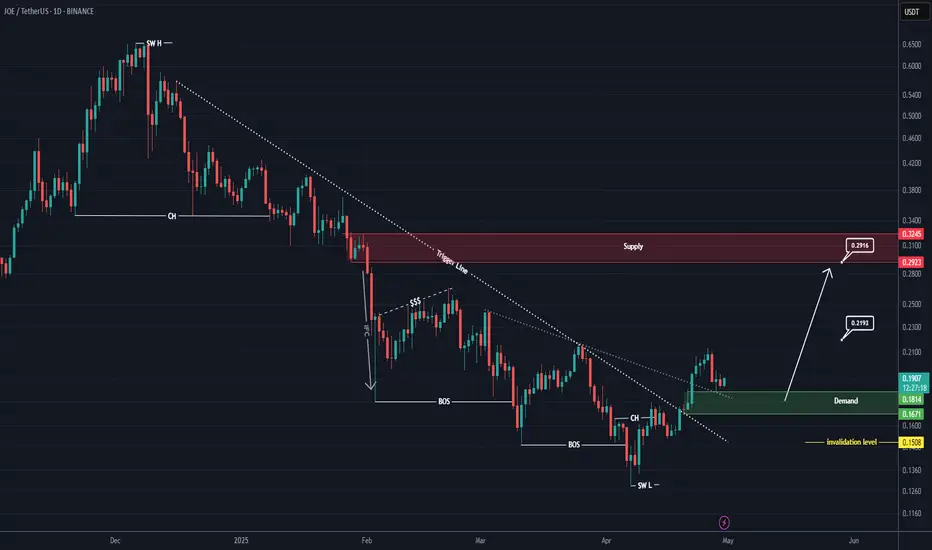
JOE Looks Bullish (1D)A 3D divergence is visible on the chart, indicating that sellers have exited their short positions.
A key trigger line has been broken, and the price has reclaimed critical levels.
We have identified two entry points where we plan to open buy/long positions.
A daily candle closing below the inval

JOE Looks Bullish (1D)Two important trigger lines have been broken, and a bullish CH (Change of Character) is also visible on the chart. A key support zone has formed, which is expected to hold.
The correction that occurred has been sufficient in terms of both time and price, and the break of the trigger line indicates
JOEUSDT 5DJOE ~ 5D Analysis
#JOE Buy gradually from here with a short -term target of at least 20%+. This is the lowest support for now.

JOE ( SPOT)BINANCE:JOEUSDT
JOE / USDT
1D time frame
analysis tools
____________
SMC
FVG
Trend lines
Fibonacci
Support & resistance
MACD Cross
EMA Cross
______________________________________________________________
Golden Advices.
********************
* Please calculate your losses before any entry.
* Do

#JOE/USDT#JOE
The price is moving in a descending channel on the 1-hour frame and is expected to continue upwards
We have a trend to stabilize above the moving average 100 again
We have a descending trend on the RSI indicator that supports the rise by breaking it upwards
We have a support area at the low

JOEUSDT 1WJOE ~ 1W Analysis
#JOE So far it still continues to maintain this support block. Buy from here if you still have a Conviction on this coin.

Can #JOE Bulls Continue this Bullish Momentum? Key Levels Yello Paradisers! Is #JOE about to break out of this falling wedge, or will the bears take full control? Here's why the next move could be massive for #JOEUSDT:
💎#JOEUSD has been trading within a falling wedge formation, consistently rejecting from its descending resistance. This pattern is typical

See all ideas
Summarizing what the indicators are suggesting.
Oscillators
Neutral
SellBuy
Strong sellStrong buy
Strong sellSellNeutralBuyStrong buy
Oscillators
Neutral
SellBuy
Strong sellStrong buy
Strong sellSellNeutralBuyStrong buy
Summary
Neutral
SellBuy
Strong sellStrong buy
Strong sellSellNeutralBuyStrong buy
Summary
Neutral
SellBuy
Strong sellStrong buy
Strong sellSellNeutralBuyStrong buy
Summary
Neutral
SellBuy
Strong sellStrong buy
Strong sellSellNeutralBuyStrong buy
Moving Averages
Neutral
SellBuy
Strong sellStrong buy
Strong sellSellNeutralBuyStrong buy
Moving Averages
Neutral
SellBuy
Strong sellStrong buy
Strong sellSellNeutralBuyStrong buy
Displays a symbol's price movements over previous years to identify recurring trends.
Frequently Asked Questions
The current price of LFJ / TETHER (JOE) is 0.165438 USDT — it has risen 0.02% in the past 24 hours. Try placing this info into the context by checking out what coins are also gaining and losing at the moment and seeing JOE price chart.
LFJ / TETHER price has fallen by −1.84% over the last week, its month performance shows a −3.84% decrease, and as for the last year, LFJ / TETHER has decreased by −43.23%. See more dynamics on JOE price chart.
Keep track of coins' changes with our Crypto Coins Heatmap.
Keep track of coins' changes with our Crypto Coins Heatmap.
LFJ / TETHER (JOE) reached its highest price on Dec 28, 2021 — it amounted to 3.000000 USDT. Find more insights on the JOE price chart.
See the list of crypto gainers and choose what best fits your strategy.
See the list of crypto gainers and choose what best fits your strategy.
LFJ / TETHER (JOE) reached the lowest price of 0.126229 USDT on Jun 22, 2025. View more LFJ / TETHER dynamics on the price chart.
See the list of crypto losers to find unexpected opportunities.
See the list of crypto losers to find unexpected opportunities.
The safest choice when buying JOE is to go to a well-known crypto exchange. Some of the popular names are Binance, Coinbase, Kraken. But you'll have to find a reliable broker and create an account first. You can trade JOE right from TradingView charts — just choose a broker and connect to your account.
Crypto markets are famous for their volatility, so one should study all the available stats before adding crypto assets to their portfolio. Very often it's technical analysis that comes in handy. We prepared technical ratings for LFJ / TETHER (JOE): today its technical analysis shows the buy signal, and according to the 1 week rating JOE shows the sell signal. And you'd better dig deeper and study 1 month rating too — it's sell. Find inspiration in LFJ / TETHER trading ideas and keep track of what's moving crypto markets with our crypto news feed.
LFJ / TETHER (JOE) is just as reliable as any other crypto asset — this corner of the world market is highly volatile. Today, for instance, LFJ / TETHER is estimated as 2.06% volatile. The only thing it means is that you must prepare and examine all available information before making a decision. And if you're not sure about LFJ / TETHER, you can find more inspiration in our curated watchlists.
You can discuss LFJ / TETHER (JOE) with other users in our public chats, Minds or in the comments to Ideas.