JOEUSDT 1D#JOE is moving inside a symmetrical triangle on the daily chart and has bounced nicely off the triangle support.
📌 In case of a breakout above the triangle resistance and the daily SMA100, the potential upside targets are:
🎯 $0.2005
🎯 $0.2478
🎯 $0.2861
🎯 $0.3244
🎯 $0.3789
🎯 $0.4483
⚠️ As always, use a tight stop-loss and apply proper risk management.
JOEUSDT trade ideas

JOE/USDT Approaching a Major Turning Point: Will Buyers Step In?🔎 Market Overview & Structure:
JOE/USDT is currently trading within a major historical demand zone between $0.1241 – $0.1548, a level that has proven to be a strong support since early 2023. Each time the price revisits this area, we’ve seen significant bounces — indicating that buyers continue to defend this zone aggressively.
However, the macro structure still reflects a clear long-term downtrend from its all-time high.
---
🧠 Why This Zone Matters (Demand Zone Characteristics):
This zone has been tested multiple times and remains intact, showing strong buyer interest and accumulation.
It acts as the final defense before a possible major breakdown.
Institutions and smart money often accumulate in zones like this – making it a Low Risk, High Reward area.
---
🟢 Bullish Scenario – Is a Mid-Term Reversal Brewing?
If the price holds above the $0.1241 level and breaks through $0.1885:
1. A reversal pattern (base or double bottom) may form.
2. Potential upside targets:
🎯 TP1: $0.1885 → First resistance breakout
🎯 TP2: $0.2332 → Key horizontal resistance
🎯 TP3: $0.4087 → Next major supply zone
🎯 TP4 (Mid-Term): $0.6254 – $0.9569 if strong bullish momentum continues
3. A daily or 5D candle close above $0.2332 with high volume would confirm a trend shift to the upside.
---
🔴 Bearish Scenario – Danger of Breakdown:
If the price breaks below $0.1241:
A new Lower Low structure will confirm continued bearish trend.
There's no major historical support below this zone, opening the door for a sharp decline into uncharted territory.
This would signal renewed seller dominance and likely a prolonged bearish phase.
---
📐 Price Patterns & Structure:
Current price action resembles an accumulation range or base formation.
Possibility of:
🔁 Double Bottom
⏳ Adam & Eve Reversal Pattern
A breakout from this range could spark a strong upside rally.
---
💡 Strategy Insights:
Accumulation Entry Zone: $0.1241 – $0.1548 with tight stop-loss.
Bullish Confirmation: Breakout and close above $0.1885 with volume.
Bearish Confirmation: Daily close below $0.1241 → avoid longs, consider shorts.
---
📌 Conclusion:
JOE/USDT is at a make-or-break level. This is a key decision point where the price could either start a mid-term bullish reversal or fall into deeper bearish territory.
For long-term investors, this is a potential accumulation zone with favorable risk-reward. For traders, it's time to watch closely for breakout or breakdown confirmations.
#JOEUSDT #CryptoAnalysis #Altcoins #BreakoutTrading #ReversalZone #DemandZone #TechnicalAnalysis #JOEToken #CryptoSetup

JOEUSDT 5D AnalysisJOE ~ 5D Analysis
#JOE Buy back from here. This is the lowest support block for now, Short term target 20%+, Long term target $0.5 - $1.4

JOE Looks Bullish (1D)A 3D divergence is visible on the chart, indicating that sellers have exited their short positions.
A key trigger line has been broken, and the price has reclaimed critical levels.
We have identified two entry points where we plan to open buy/long positions.
A daily candle closing below the invalidation level will invalidate this analysis
Do not enter the position without capital management and stop setting
Comment if you have any questions
thank you

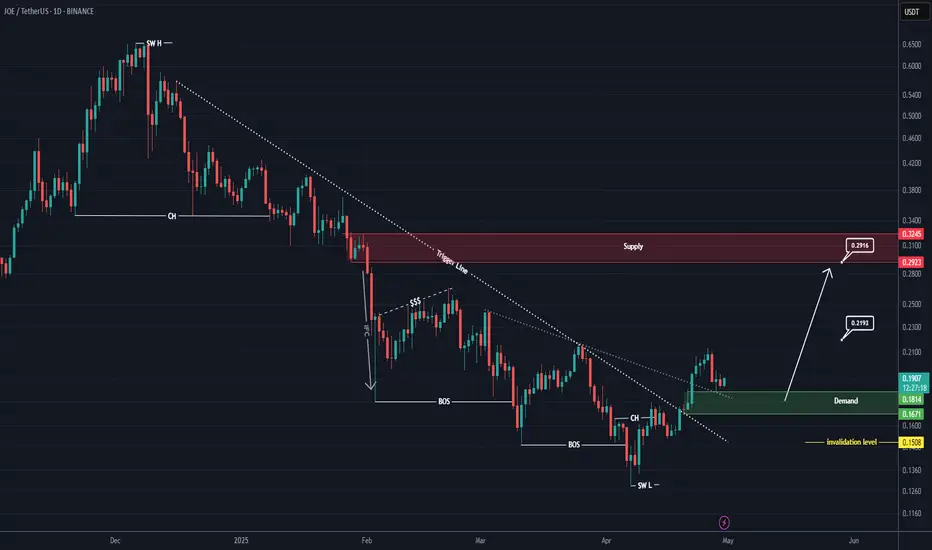
JOE Looks Bullish (1D)Two important trigger lines have been broken, and a bullish CH (Change of Character) is also visible on the chart. A key support zone has formed, which is expected to hold.
The correction that occurred has been sufficient in terms of both time and price, and the break of the trigger line indicates that the correction is likely over.
There is also a liquidity pool above the chart that is expected to be swept soon
Targets are marked on the chart.
A daily candle closing below the invalidation level would invalidate this analysis.
For risk management, please don't forget stop loss and capital management
Comment if you have any questions
Thank You
JOEUSDT 5DJOE ~ 5D Analysis
#JOE Buy gradually from here with a short -term target of at least 20%+. This is the lowest support for now.

JOE ( SPOT)BINANCE:JOEUSDT
JOE / USDT
1D time frame
analysis tools
____________
SMC
FVG
Trend lines
Fibonacci
Support & resistance
MACD Cross
EMA Cross
______________________________________________________________
Golden Advices.
********************
* Please calculate your losses before any entry.
* Do not enter any trade you find it not suitable for you.
* No FOMO - No Rush , it is a long journey.
Useful Tags.
****************
My total posts
www.tradingview.com

#JOE/USDT#JOE
The price is moving in a descending channel on the 1-hour frame and is expected to continue upwards
We have a trend to stabilize above the moving average 100 again
We have a descending trend on the RSI indicator that supports the rise by breaking it upwards
We have a support area at the lower limit of the channel at a price of 0.2222
Entry price 0.2530
First target 0.2661
Second target 0.2826
Third target 0.3032

JOEUSDT 1WJOE ~ 1W Analysis
#JOE So far it still continues to maintain this support block. Buy from here if you still have a Conviction on this coin.

Can #JOE Bulls Continue this Bullish Momentum? Key Levels Yello Paradisers! Is #JOE about to break out of this falling wedge, or will the bears take full control? Here's why the next move could be massive for #JOEUSDT:
💎#JOEUSD has been trading within a falling wedge formation, consistently rejecting from its descending resistance. This pattern is typically bullish, but we need a confirmed breakout before expecting an explosive move. Currently, JOE is holding above a strong support zone at $0.1390 - $0.2099, where buyers have previously stepped in.
💎A bullish divergence is forming on the MACD histogram, suggesting weakening bearish momentum. However, for bulls to take charge, #JOE must break through the descending resistance and reclaim $0.3709 as support. If this happens, we could see a strong rally toward the $0.60+ zone, where major resistance awaits.
💎The major support zone sits at $0.209 because the bulls have stepped here to defend this level. However, if it fails, the last line of defense is at the $0.139 strong support level. As long as support holds, buyers have a chance to push #JOE higher.
💎If the support at $0.139 fails, the bearish scenario could unfold, driving #JOEUSD into a deeper correction phase. The structure remains intact for now, but a breakdown would trigger further downside risk.
Stay focused, patient, and disciplined, Paradisers🥂
MyCryptoParadise
iFeel the success🌴

Alikze »» JOE | Ascending channel - 1W🔍 Technical analysis: Ascending channel - 1W
📣 BINANCE:JOEUSDT It is moving in an ascending channel on the weekly time frame.
🟢 Given the positive reactions and demand in the bottom area of the ascending channel, the upward movement can continue its growth to the supply area and, if supported in the middle area of the channel, the movement can continue to the ceiling of the ascending channel.
💎 Furthermore, with the failure of the first ascending channel, it can continue its growth to the extent of the first channel to the large supply area.
⚠️ In addition, if the ascending channel breaks and consolidates below it, the upward scenario is invalidated and must be re-examined and updated. ⚠️
»»»«««»»»«««»»»«««
Please support this idea 💡 with a LIKE 👍 and COMMENT 💬 if you find it useful and Click "Follow" on our profile if you'd like these trade ideas delivered straight to your email 📧 in the future.
Thanks for your continued support.🙏
Best Regards,❤️
Alikze.
»»»«««»»»«««»»»«««

#JOE (SPOT) entry ( 0.3000 - 0.3900) T.(1.9400) SL(0.2809)BINANCE:JOEUSDT
#JOE / USDT
Entry ( 0.3000 - 0.3900)
SL 1D close below 0.2809
T1 0.7420
T2 0.9500
T3 1.3000
T4 1.9400
This trade is updating for last trade due to Bull run situation now ........ check it below
______________________________________________________________
Golden Advices.
********************
* collect the coin slowly in the entry range.
* Please calculate your losses before the entry.
* Do not enter any trade you find it not suitable for you.
* No FOMO - No Rush , it is a long journey.
Useful Tags.
****************
My total posts
www.tradingview.com
1Million Journey
www.tradingview.com
www.tradingview.com
**********************************************************************************************
#Manta #OMNI #DYM #AI #IO #XAI #ACE #NFP #RAD #WLD #ORDI #BLUR #SUI #VOXEL #AEVO #VITE #APE #RDNT #FLUX #NMR #VANRY #TRB #HBAR #DGB #XEC #ERN #ALT #IO #ACA #HIVE #ASTR #ARDR #PIXEL #LTO #AERGO #SCRT #ATA #HOOK #FLOW #KSM #HFT #MINA #DATA #SC #JOE #RDNT #IQ #CFX #BICO #CTSI #KMD #FXS #DEGO #FORTH #AST #PORTAL #CYBER #RIF #ENJ #ZIL #APT #GALA #STEEM #ONE #LINK #NTRN #COTI #RENDER #ICX #IMX #ALICE #PYR #PORTAL #GRT #GMT #IDEX #NEAR #ICP #ETH #QTUM #VET #QNT #API3 #BURGER #MOVR #SKL #BAND #ETHFI #SAND #IOTX #T #GTC #PDA #GMX #REZ #DUSK #BNX #SPELL #POWR #JOE

Liquidity Zone Detector for Crypto Tradersa powerful indicator that identifies key liquidity zones where prices are likely to reverse or experience volatility. Perfect for crypto and memecoin traders, it highlights buy (B) and sell (S) zones, enabling smarter entries and exits. Customizable and optimized for volatile markets, this tool is your edge in trading chaos.

#JOE/USDT#JOE
The price is moving within a bearish channel pattern on the 12-hour frame, which is a strong retracement pattern
We have a bounce from a major support area in green at 0.2600
We have a tendency to stabilize above the Moving Average 100
We have an upward trend on the RSI indicator that supports the rise and gives greater momentum, upon which the price is based higher at the discount
Entry price is 0.3000
The first target is 0.3694
The second target is 0.4290
The third goal is 0.4968

#JOE (SPOT) entry range(0.3000 - 0.3830) T.(0.7420) SL(0.2809)BINANCE:JOEUSDT
entry range (0.3000 - 0.3830)
Target1 (0.7420)
1 Extra Targets(optional) in chart, if you like to continue in the trade with making stoploss very high.
SL .1D close below (0.2809)
1:3 Trade
*** collect the coin slowly in the entry range ***
*** this coin is very heavy, it may take long time to achieve the target***
**** #Manta ,#OMNI, #DYM, #AI, #IO, #XAI , #ACE #NFP #RAD #WLD #ORDI #BLUR #SUI #Voxel #AEVO #VITE #APE #RDNT #FLUX #NMR #VANRY #TRB #HBAR #DGB #XEC #ERN #ALT #IO #ACA #HIVE #ASTR #ARDR #PIXEL #LTO #AERGO #SCRT #ATA #HOOK #FLOW #KSM #HFT #MINA #DATA #SC #JOE ****

JOEUSDTJOE ~ 1W
#JOE If you are a holder of this Coin,. one of these support blocks will bouncing the price. if you want to buy again,. You can place on one of these support blocks. Minimum target 20%++

JOEUSDT Potential Bullish Continuation Towards 0.4200 ResistanceThe market has formed a clear range between support at approximately 0.3100 and resistance around 0.4200. A double-bottom pattern was observed near the 0.3100 level, which led to a breakout upwards. The price is currently consolidating above the middle of the range, with a potential upward movement towards the 0.4200 resistance zone.
Key observation:
If price holds above the current support level (around 0.3500), it may continue its upward momentum towards 0.4200.
The overall market is showing a potential bullish reversal after forming higher lows.
Stop-loss could be placed below 0.3400 to mitigate risk in case of a downside breakout.

JOEUSDT 1D - Bullish Flag in Resistance ZoneJOEUSDT 1D - Bullish Flag in Resistance Zone
JOEUSDT 1D has drawn a bullish flag that could lead the value in search of $0.50.
The price range where it is at the moment is a strong resistance zone, so it could maintain it for a while.
We will have to keep in mind the dynamic support to exit the value in case it turns around.
The objectives are clearly marked.
This strategy can be executed with TradeX BoT when we finish developing it.
TradeX BoT (in development):
Tool to automate trading strategies designed in TradingView. It works with both indicators and graphic design tools: parallel channels, trend lines, supports, resistances... It allows you to easily establish SL (%), TP (%), SL Trailing... multiple strategies in different values, simultaneous BUY-SELL orders, conditional orders.
This tool is in the development process and the BETA will soon be ready for testing.
FOLLOW ME and I will keep you informed of the progress we make.
I share with you my technical analysis assessments on certain stocks that I follow as part of the strategies I design for my portfolio, but I do not recommend anyone to operate based on these indications. Get informed, train yourself and build your own strategies when it comes to investing. I only hope that my comments help you on your own path :)

JOEUSDT Symmetric Traingle!JOEUSDT technical analysis update
JOE price has broken out of the triangle pattern and is now retesting the support line. Once the retest is complete, we can expect a strong bullish move.
And JOE price trading above 100 EMA
Regards
Hexa

The importance of waiting for patterns to confirmGood morning,
I am monitoring the AVAX ecosystem and was paying close attention to JOE. When I checked the USDT pair I could notice a possible falling wedge forming:
Then, I checked the BTC pair, and I found a possible inverse head and shoulders:
So far we have not confirmed any pattern, and the pum that the AVAX ecosystem experienced, is fading, so what I get from here is the importance of confirming patterns.
Even if they are right eventually, your funds would be stuck in there, and you would miss other great oportunities.

JOEUSDT 1D Has it bottomed out?JOEUSDT 1D Has it bottomed out?
Like many ALTCOINS, JOE seems to have bottomed out.
JOE is one of the key pieces of the AVALANCHE ecosystem that channels a significant volume of transactions that are carried out on this blockchain.
Regardless of what BTC does and whether it drags the prices of the entire crypto ecosystem more or less, there are stocks that are very attractive at these prices :)
TP 0.9
SL 0.22

JOE ANALYSIS (12H)It seems that on the chart we have a large diametric that the F wave is ending.
The green range is the best and least risky place for buy/long positions.
The targets are marked on the chart.
Closing a daily candle below the invalidation level will violate the analysis.
For risk management, please don't forget stop loss and capital management
Comment if you have any questions
Thank You

JOEUSDT is BullishPrice has given a good breakout following bullish RSI divergence on daily time frame. It seems that bulls have take control of the price action, the notion is further validated by the break of previous lower high and printing of a higher high. Price is now in the process of defining a higher low, after which according to Dow theory we can expect further highs. Targets are mentioned on the chart.
