AUDJPY to find buyers at previous resistance?AUDJPY - 24h expiry
There is no indication that the rally is coming to an end.
Further upside is expected.
Risk/Reward would be poor to call a buy from current levels.
A move through 91.00 will confirm the bullish momentum.
The measured move target is 92.00.
We look to Buy at 89.50 (stop at 88.50)
Our profit targets will be 91.50 and 92.00
Resistance: 91.00 / 91.50 / 92.00
Support: 90.00 / 89.50 / 89.00
Risk Disclaimer
The trade ideas beyond this page are for informational purposes only and do not constitute investment advice or a solicitation to trade. This information is provided by Signal Centre, a third-party unaffiliated with OANDA, and is intended for general circulation only. OANDA does not guarantee the accuracy of this information and assumes no responsibilities for the information provided by the third party. The information does not take into account the specific investment objectives, financial situation, or particular needs of any particular person. You should take into account your specific investment objectives, financial situation, and particular needs before making a commitment to trade, including seeking advice from an independent financial adviser regarding the suitability of the investment, under a separate engagement, as you deem fit.
You accept that you assume all risks in independently viewing the contents and selecting a chosen strategy.
Where the research is distributed in Singapore to a person who is not an Accredited Investor, Expert Investor or an Institutional Investor, Oanda Asia Pacific Pte Ltd (“OAP“) accepts legal responsibility for the contents of the report to such persons only to the extent required by law. Singapore customers should contact OAP at 6579 8289 for matters arising from, or in connection with, the information/research distributed.
JPYAUD trade ideas

Bullish bounce off pullback support?AUD/JPY is falling towards the pivot which acts as a pullback support and could bounce to the 1st resistance which is an overlap resistance.
Pivot: 89.50
1st Support: 87.82
1st Resistance: 93.06
Risk Warning:
Trading Forex and CFDs carries a high level of risk to your capital and you should only trade with money you can afford to lose. Trading Forex and CFDs may not be suitable for all investors, so please ensure that you fully understand the risks involved and seek independent advice if necessary.
Disclaimer:
The above opinions given constitute general market commentary, and do not constitute the opinion or advice of IC Markets or any form of personal or investment advice.
Any opinions, news, research, analyses, prices, other information, or links to third-party sites contained on this website are provided on an "as-is" basis, are intended only to be informative, is not an advice nor a recommendation, nor research, or a record of our trading prices, or an offer of, or solicitation for a transaction in any financial instrument and thus should not be treated as such. The information provided does not involve any specific investment objectives, financial situation and needs of any specific person who may receive it. Please be aware, that past performance is not a reliable indicator of future performance and/or results. Past Performance or Forward-looking scenarios based upon the reasonable beliefs of the third-party provider are not a guarantee of future performance. Actual results may differ materially from those anticipated in forward-looking or past performance statements. IC Markets makes no representation or warranty and assumes no liability as to the accuracy or completeness of the information provided, nor any loss arising from any investment based on a recommendation, forecast or any information supplied by any third-party.

Bearish Setup on AUDJPY – Waiting for POI ReactionCurrently bearish on AUDJPY due to higher time frame structure showing signs of weakness. However, I’m exercising patience as I have two key areas of interest (POIs) I’m watching closely:
Primary POI (Point of Interest):
This is a refined supply zone within the premium zone, where I expect price to retrace before giving any bearish confirmation. Ideally, I want to see a clear rejection or distribution pattern here before executing a short position.
Extreme POI (Last Line of Defense):
In case price breaks through the primary POI without a solid rejection, I will wait for price to reach this deeper, more extreme supply zone. This is my most conservative entry area and aligns with higher risk-to-reward expectations.
Trade Plan:
No entry until price pulls back into one of the POIs.
Looking for confirmation (e.g., break of structure, bearish engulfing, supply taking over demand) before executing a sell.
Targeting previous demand levels or liquidity zones below current price.
Stop loss will depend on the POI used, with risk managed accordingly.
Bias: Bearish
Status: Waiting for retracement and confirmation.

AUD/JPY Technical Outlook: Wave 5 Completion in SightIn AUD/JPY, the 4th wave has been completed, and the 5th wave is in progress. According to Elliott Wave theory, there is a high probability of the market continuing its downward movement.
Regarding potential targets, the price may reach 88.151 and 87.365 on the downside. However, a bullish move could also emerge if the market breaks above 89.645 .

AUDJPY Sell Opportunity: Analyzing Market Trends with EASY TradiBased on the latest EASY Trading AI analysis, AUDJPY presents an attractive selling scenario. The recommended entry is precisely at 87.061, targeting a Take Profit at the 86.05 mark, with a cautious Stop Loss at 88.869.The sell signal arises from reliable indicators showing weakening upward momentum and bearish pressure forming clearly at current resistance levels. EASY Trading AI’s evaluation of recent price action identifies increased selling volume and reduced bullish participation, signaling a likely downward correction.Carefully monitor your risk parameters and follow this clearly defined trading plan for optimal risk-reward management.

AUD/JPY Selloff Keeps RSI in Oversold TerritoryAUD/JPY marks a five-day selloff as it extends the decline from the start of the week, with the recent weakness in the exchange rate keeping the Relative Strength Index (RSI) in oversold territory.
AUD/JPY Outlook
Keep in mind, AUD/JPY cleared the 2024 low (90.40) following the failed attempts to close above the 50-Day SMA (94.38), and the move below 30 in the RSI is likely to be accompanied by a further decline in the exchange rate like the price action from last year.
A move/close below the 0.8660 (78.6% Fibonacci retracement) to 0.8740 (78.6% Fibonacci extension) zone brings the 2023 low (86.06) back on the radar, with the next area of interest coming in around 85.20 (100% Fibonacci extension.
At the same time, lack of momentum to close below the 0.8660 (78.6% Fibonacci retracement) to 0.8740 (78.6% Fibonacci extension) zone may pull the RSI back from overbought territory, with a breach/close above 89.20 (61.8% Fibonacci extension) raising the scope for a move towards 90.50 (61.8% Fibonacci extension).
--- Written by David Song, Senior Strategist at FOREX.com

AUDJPY Sell immediately we've seen the pair taking the buyside liquidity by sweeping the recent high nd breaking the low we now expect a short for a while

AUD/JPY H1 | Upward momentum gaining traction?AUD/JPY is falling towards a pullback support and could potentially bounce off this level to climb higher.
Buy entry is at 88.75 which is a pullback support.
Stop loss is at 87.60 which is a level that lies underneath an overlap support and the 61.8% Fibonacci retracement.
Take profit is at 90.63 which is a pullback resistance that aligns with the 50.0% Fibonacci retracement.
High Risk Investment Warning
Trading Forex/CFDs on margin carries a high level of risk and may not be suitable for all investors. Leverage can work against you.
Stratos Markets Limited (www.fxcm.com):
CFDs are complex instruments and come with a high risk of losing money rapidly due to leverage. 63% of retail investor accounts lose money when trading CFDs with this provider. You should consider whether you understand how CFDs work and whether you can afford to take the high risk of losing your money.
Stratos Europe Ltd (www.fxcm.com):
CFDs are complex instruments and come with a high risk of losing money rapidly due to leverage. 63% of retail investor accounts lose money when trading CFDs with this provider. You should consider whether you understand how CFDs work and whether you can afford to take the high risk of losing your money.
Stratos Trading Pty. Limited (www.fxcm.com):
Trading FX/CFDs carries significant risks. FXCM AU (AFSL 309763), please read the Financial Services Guide, Product Disclosure Statement, Target Market Determination and Terms of Business at www.fxcm.com
Stratos Global LLC (www.fxcm.com):
Losses can exceed deposits.
Please be advised that the information presented on TradingView is provided to FXCM (‘Company’, ‘we’) by a third-party provider (‘TFA Global Pte Ltd’). Please be reminded that you are solely responsible for the trading decisions on your account. There is a very high degree of risk involved in trading. Any information and/or content is intended entirely for research, educational and informational purposes only and does not constitute investment or consultation advice or investment strategy. The information is not tailored to the investment needs of any specific person and therefore does not involve a consideration of any of the investment objectives, financial situation or needs of any viewer that may receive it. Kindly also note that past performance is not a reliable indicator of future results. Actual results may differ materially from those anticipated in forward-looking or past performance statements. We assume no liability as to the accuracy or completeness of any of the information and/or content provided herein and the Company cannot be held responsible for any omission, mistake nor for any loss or damage including without limitation to any loss of profit which may arise from reliance on any information supplied by TFA Global Pte Ltd.
The speaker(s) is neither an employee, agent nor representative of FXCM and is therefore acting independently. The opinions given are their own, constitute general market commentary, and do not constitute the opinion or advice of FXCM or any form of personal or investment advice. FXCM neither endorses nor guarantees offerings of third-party speakers, nor is FXCM responsible for the content, veracity or opinions of third-party speakers, presenters or participants.

AUDJPYAUDJPY buy target is 94.307,as the Australian dollar resumes buying the bulls wont stop until we touch 94.307 as strong supply roof.

A Practical Framework for Overcoming Fear in Trading“Fear is not real. The only place that fear can exist is in our thoughts of the future. It is a product of our imagination, causing us to fear things that do not at present and may not ever exist. Do not misunderstand me, danger is very real, but fear is a choice.” - Will Smith, After Earth
Although I firmly agree with this statement, I also have to acknowledge that while fear is a choice, it’s also a biological response to perceived threats like uncertainty, lack of control, and experience.
When faced with these threats the brain activates the amygdala which triggers the fight or flight response releasing hormones like cortisol and adrenaline, preparing the body to respond quickly and instinctively.
If left alone, traders consumed with fear will either seek to take vengeance against the markets, typically referred to as “Revenge Trading” or they’ll hesitate when taking the next position fearing that it would be a repeat of the last. Either way, it never ends well.
In today’s article we’re going to be breaking down fear both figuratively and literally, by gaining a deeper understanding on how it works and what steps we should take to overcome it.
Three Types of Fears in Trading:
Now I’m sure most of you reading this article are familiar with the three types of fears related to trading, so I’ll go through these quite briefly but for those of you who might not be that familiar I’ll leave a short explanation for each of the fears highlighted.
Fear of Missing Out (FOMO):
The apprehension of missing profitable opportunities leads traders to enter trades impulsively without proper analysis, often resulting in poor outcomes. Traders experiencing FOMO generally find themselves in trading signal groups or rely on social media for direction, see my previous article on Trading Vs. Social Media
Fear of Losing Money:
The anxiety associated with potential financial loss can cause traders to exit positions prematurely or avoid taking necessary risks. This fear is closely linked to loss aversion, where the pain of losing is felt more intensely than the pleasure of equivalent gains.
Fear of Being Wrong:
The discomfort of making incorrect decisions can deter traders from executing trades or cause them to hold onto losing positions in an attempt to prove their initial decision was right.
In many respects, traders try to deal with these fears directly but usually without much success. This is because they’re treating the symptom but not the cause.
In order to deal with any of these fears either independently or collectively you’d need to first learn to become comfortable in three very specific areas.
Uncertainty - At its core, trading is a game of probabilities, not certainties. Certainty in trading comes only when you’re able to shift your focus from the outcome of any one trade to your ability to take any one trade regardless of the outcome. Remember, it's not your job to predict the future, rather you should prepare for it.
Past Losses - The outcome of one trade has absolutely no impact on the outcome of the next, and the best way to deal with past losses is to embrace the lessons that came with it.
Lack of Control - Although we cannot control the outcome of a trade, we do control the type of trade we take. We can control when we enter, exit, and how much we risk, which when examined closely carries far more significance than merely seeking to control the outcome.
Debunking The Biggest Myth In Trading
If you won then you were right, if you lost then you were wrong. This is the biggest myth in trading today and one of the main reasons why so many traders chose being right over being profitable.
Instead of accepting a loss, they’ll remove whatever stop loss they had in place in the hope that the market will eventually turn in their favor, refusing to accept that they may have been wrong.
There are very good reasons for this type of behaviour which is tied directly to our identity, social belonging and self-worth. When we’re faced with the possibility of being wrong our intellect, competency and self-image is challenged.
In order to protect ourselves from this challenge, we begin to resist any new information that could conflict or even threaten our existing belief, creating discomfort even when the evidence is clear.
This can trigger emotions like anxiety and avoidance behaviour which can show up in the form of hesitation, overthinking, or avoiding placing trades altogether. However, I’m about to share a framework with you that will help you overcome the fear of being wrong and instead of avoiding it, if you follow this framework, you’ll begin to embrace it.
3 Step Process To Profit From Being Wrong
In trading Losses are inevitable. In fact, some of the most successful traders lose far more times than they actually win, and yet they’re still able to make money. This is because you don’t need to be a winning trader in order to be a profitable one.
It’s under this principle that you’ll apply the 3 step process to profit from being wrong.
1. Reframe “Wrong” as “Feedback”
Generally being wrong comes with consequences, in trading those consequences comes in the form of losses. However, you determine how much you’re willing to lose on any given trade. This means that because you control how much you’re willing to lose, you ultimately control the consequences.
The market is a nearly endless pool of trade opportunities and no one trade can determine the outcome of the next. Therefore, a losing trade cannot mean you were wrong, because as long as you still have capital to trade there is another opportunity lining up.
Instead, what the losing trade does uncover is the market conditions in relation to your plan. It’s at this point where you review your initial analysis and see if anything has changed. If nothing changed, then it's likely you may have gotten in a bit too early and you’d just have to wait for the next setup.
However, upon your review, you discover the market conditions have changed, and you now have to re-evaluate your approach, then this is the feedback the market is giving you. This is what it means to take feedback from the markets and this is what it takes to be profitable instead of being right.
2. Separate Identity From Outcome
The mistake many trades tend to make is measuring their success on the outcome of a trade. This is a recipe for disaster because in order for them to feel successful they’d have to win every single time.
This of course is impossible, instead I’d encourage you to separate yourself from the outcome of the trade and focus on just trading. There are only one of three outcomes you can experience in a trade. 1. Loss, 2. Win, 3. Breakeven. When you’re able to accept 1. Loss then you don’t have to worry about numbers 2,3.
Because you control how much you’re willing to lose you should be able to accept what you’re willing to lose, and by accepting what you're willing to lose you’ve then separated yourself from the outcome of the trade and you can now focus on just trading.
To keep you in check with this step here is a very simple but highly effective practice:
✅ Practice saying: “This was a good trade with a bad outcome — and that’s okay.”
3. Celebrate The Process, Not Perfection
“That which gets rewarded gets repeated” If you’re only rewarding yourself when you close a winning trade then you’re simply reinforcing the notion of viewing the markets through the lens of right and wrong.
As we’ve already discovered this view is detrimental to your longevity as a trader and so I would argue that instead of celebrating a winning trade, celebrate your process. Reward yourself every time you follow your plan regardless if the trade resulted in a win, loss or breakeven.
This approach will help you improve your process which in turn will improve your overall returns and performance.
Conclusion
📣 You are not here to be perfect. You’re here to grow, to learn, and to keep showing up — fear and all.
The market rewards the trader who is calm under pressure, humble in defeat and focused on the long game.
Go into this week knowing that fear may still show up — but you’re more prepared than ever to handle it.
Let fear be a signal, not a stop sign.
You've got this. 🚀

AUDJPY REVERSAL DAILY is bearish, Took a quick buy on the reversal expecting it to turn bearish soon. set BE once hit danger zone
i only exit with SL BE TP nothing else,
once it tap the danger zone i put BE


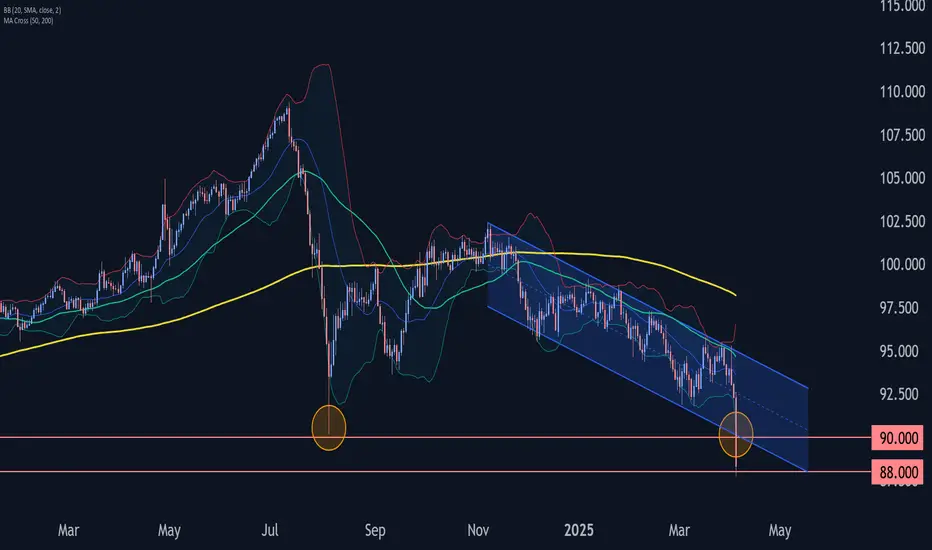
AUDJPY Wave Analysis – 4 April 2025
- AUDJPY broke support level 90.00
- Likely to fall to support level 88.00
AUDJPY currency pair recently broke the round support level 90.00 (former multi-month low from August) intersecting with the support trendline of the daily down channel from November.
The breakout of the support level 90.00 accelerated the minor impulse wave 3 of the intermediate impulse wave (3) from November.
Given the strongly bullish yen sentiment and long-term downtrend, AUDJPY currency pair can be expected to fall to the next support level 88.00 (target price for the completion of the active impulse wave 3).
Breakdown of the week for OliMy overview of the price action this week and run down of pairs on watch and trades not taken.


AUD-JPY Will Keep Falling! Sell!
Hello,Traders!
AUD-JPY made a bearish
Breakout then made a retest
And is going down again
So we are bearish biased
And we will be expecting
A further bearish continuation
Sell!
Comment and subscribe to help us grow!
Check out other forecasts below too!
Disclosure: I am part of Trade Nation's Influencer program and receive a monthly fee for using their TradingView charts in my analysis.

AUDJPY INTRADAY capped by resistance at 94.45 The AUDJPY pair is in an overall downtrend, though currently experiencing a short-term oversold bounce back.
Key Resistance: 94.45 – A bearish rejection from this level could push prices lower.
Bearish Scenario: A break below 94.45 could lead to further declines toward 92.70, 92.00, and 91.70.
Alternatively a breakout above 94.45 and a daily close higher would negate a bearish outlook.
Upside Targets: 95.20, 95.70, and 96.20 if the bullish trend continues.
Conclusion: The trend remains bearish unless AUDJPY closes above 94.45, which would signal further upside risk.
This communication is for informational purposes only and should not be viewed as any form of recommendation as to a particular course of action or as investment advice. It is not intended as an offer or solicitation for the purchase or sale of any financial instrument or as an official confirmation of any transaction. Opinions, estimates and assumptions expressed herein are made as of the date of this communication and are subject to change without notice. This communication has been prepared based upon information, including market prices, data and other information, believed to be reliable; however, Trade Nation does not warrant its completeness or accuracy. All market prices and market data contained in or attached to this communication are indicative and subject to change without notice.

AUDJPY LONGAudjpy is still bullish. We are waiting for the pair to touch the support at 92.100 in order to buy without fear. Otherwise you can sell in order to buy but i wont gp for that

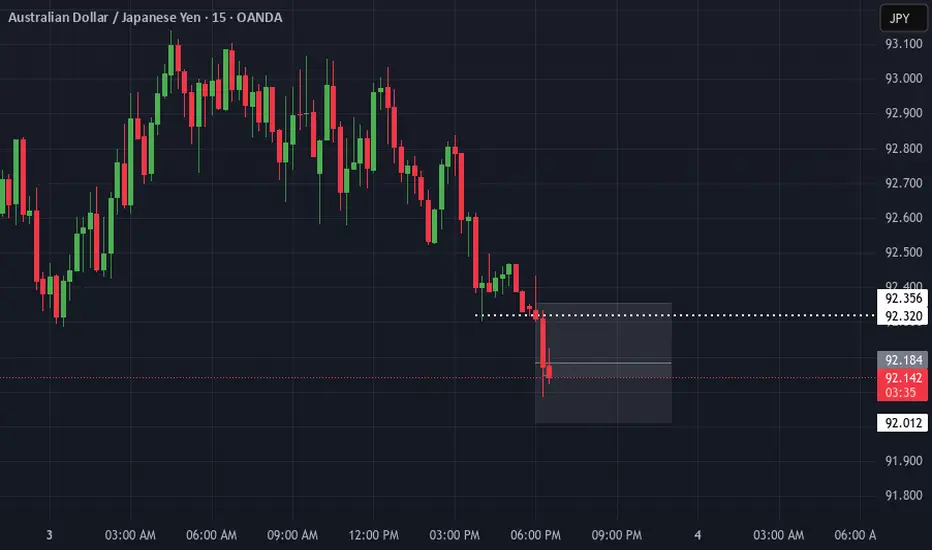
AUDJPY to find sellers at market price?AUDJPY - 24h expiry
There is no indication that the selloff is coming to an end.
Further downside is expected.
Risk/Reward would be poor to call a sell from current levels.
A move through 92.50 will confirm the bearish momentum.
The measured move target is 91.75.
We look to Sell at 93.00 (stop at 93.50)
Our profit targets will be 92.00 and 91.75
Resistance: 92.75 / 93.00 / 93.25
Support: 92.25 / 92.00 / 91.75
Risk Disclaimer
The trade ideas beyond this page are for informational purposes only and do not constitute investment advice or a solicitation to trade. This information is provided by Signal Centre, a third-party unaffiliated with OANDA, and is intended for general circulation only. OANDA does not guarantee the accuracy of this information and assumes no responsibilities for the information provided by the third party. The information does not take into account the specific investment objectives, financial situation, or particular needs of any particular person. You should take into account your specific investment objectives, financial situation, and particular needs before making a commitment to trade, including seeking advice from an independent financial adviser regarding the suitability of the investment, under a separate engagement, as you deem fit.
You accept that you assume all risks in independently viewing the contents and selecting a chosen strategy.
Where the research is distributed in Singapore to a person who is not an Accredited Investor, Expert Investor or an Institutional Investor, Oanda Asia Pacific Pte Ltd (“OAP“) accepts legal responsibility for the contents of the report to such persons only to the extent required by law. Singapore customers should contact OAP at 6579 8289 for matters arising from, or in connection with, the information/research distributed.

AUDJPY - Follow The Bears!Hello TradingView Family / Fellow Traders. This is Richard, also known as theSignalyst.
📈AUDJPY has been bearish trading within the falling channel in red.
Currently, AUDJPY is approaching the upper bound of the channel.
Moreover, it is retesting a strong structure marked in orange.
🏹 Thus, the highlighted red circle is a strong area to look for sell setups as it is the intersection of the structure and upper red trendline.
📚 As per my trading style:
As #AUDJPY is around the red circle zone, I will be looking for bearish reversal setups (like a double top pattern, trendline break , and so on...)
📚 Always follow your trading plan regarding entry, risk management, and trade management.
Good luck!
All Strategies Are Good; If Managed Properly!
~Rich
Disclosure: I am part of Trade Nation's Influencer program and receive a monthly fee for using their TradingView charts in my analysis.
