AUD JPY Moving in channel and reached the supportAUD JPY likely to move towards the 94.4. The inside channel shows a wedge pattern and will hit the higher low of main channel.
JPYAUD trade ideas


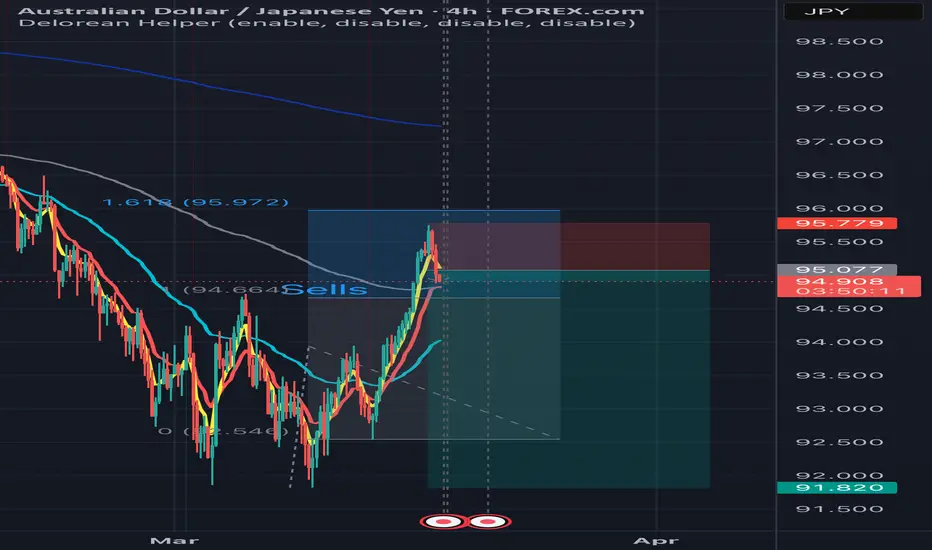
Gold Potential UpsidesHey Traders, in today's trading session we are monitorig AUDJPY for a selling opportunity around 94.600 zone, AUDJPY is trading in a downtrend and currently is in a correction phase in which it s approaching the trend at 94.600 support and resistance area.
Trade safe, Joe.

AUD_JPY RISKY LONG|
✅AUD_JPY made a retest
Of the horizontal support
Of 94.600 after a breakout
Earlier so we are bullish
Biased and we will be expecting
A further move up
LONG🚀
✅Like and subscribe to never miss a new idea!✅
Disclosure: I am part of Trade Nation's Influencer program and receive a monthly fee for using their TradingView charts in my analysis.

AUDJPY, 4H [COUNTER TREND TRADE]AUDJPY is on the bearish trend but I see a good BUY opportunity.
This is a counter trend trade = high risk trade

AUDJPY Triangular BreakoutWe're looking at a potential buy on AUDJPY with a Triangular Breakout. Expecting price to reach around 95.70 zone within next few hours


Bullish bounce off pullback support?AUD/JPY is falling towards the pivot and could bounce to the 1st resistance.
Pivot: 93.98
1st Support: 92.83
1st Resistance: 95.57
Risk Warning:
Trading Forex and CFDs carries a high level of risk to your capital and you should only trade with money you can afford to lose. Trading Forex and CFDs may not be suitable for all investors, so please ensure that you fully understand the risks involved and seek independent advice if necessary.
Disclaimer:
The above opinions given constitute general market commentary, and do not constitute the opinion or advice of IC Markets or any form of personal or investment advice.
Any opinions, news, research, analyses, prices, other information, or links to third-party sites contained on this website are provided on an "as-is" basis, are intended only to be informative, is not an advice nor a recommendation, nor research, or a record of our trading prices, or an offer of, or solicitation for a transaction in any financial instrument and thus should not be treated as such. The information provided does not involve any specific investment objectives, financial situation and needs of any specific person who may receive it. Please be aware, that past performance is not a reliable indicator of future performance and/or results. Past Performance or Forward-looking scenarios based upon the reasonable beliefs of the third-party provider are not a guarantee of future performance. Actual results may differ materially from those anticipated in forward-looking or past performance statements. IC Markets makes no representation or warranty and assumes no liability as to the accuracy or completeness of the information provided, nor any loss arising from any investment based on a recommendation, forecast or any information supplied by any third-party.

BUYGod First
Minimum Risk Maximum Reward
Action Backed Believe
# faith, strategy, and execution all in one #

AUD-JPY Bullish Continuation Expected! Buy!
Hello,Traders!
AUD-JPY is trading in a
Local uptrend and the pair
Made a bearish correction
And then retested the
Horizontal support of 94.595
And we are already seeing a
Bullish reaction from the
Support so as we are
Locally bullish biased
And we will be expecting
A further bullish move up
Buy!
Comment and subscribe to help us grow!
Check out other forecasts below too!
Disclosure: I am part of Trade Nation's Influencer program and receive a monthly fee for using their TradingView charts in my analysis.

AudjpyTrend fibonacci plus emas cross over in 1 hr timeframe. Pure technical analysis no news or stuff
AUDJPY Buy ForecastAUDJPY New Forecast👨💻👨💻
This is my personal trade and not in anyway a mandatory setup.
Note:
Follow proper risk management rules. Never risk more then 2% of your total capital. Money management is the key of success in this business...... Set your own SL & TP.
Please support this idea with a Like and COMMENT if you find it useful click "follow" on our profile if you will like these type of trading ideas delivered straight to your email in the future.
Thanks for your continued support!! lemme know your thoughts in the comment sec..

AUD/JPY Chart AnalysisAUD/JPY Chart Analysis
**Key Patterns Identified:**
1. **Rectangle Pattern (Range-bound Market)**
- The price traded within a horizontal range, forming a consolidation zone.
- Two clear support touches at the bottom of the range (labeled as Bottom 1 and Bottom 2).
- The price respected both support and resistance levels multiple times before breaking out.
2. **Double Bottom Formation**
- A classic reversal pattern, signaling potential bullish momentum.
- Bottom 1 and Bottom 2 indicate strong support, where buyers stepped in.
- The breakout above the rectangle confirms the pattern, suggesting further upside potential.
**Breakout Confirmation:**
- The price successfully **broke out** above the rectangle's resistance.
- Volume increased during the breakout, supporting bullish momentum.
- Moving Averages (EMA 7, 21, and 50) are aligned bullishly, confirming the uptrend.
**Target Projection:**
- The expected target is measured based on the rectangle’s height.
- The breakout suggests a potential move towards **97.00** as the next resistance zone.
**Key Levels to Watch:**
- **Support:** 94.50 (previous range support), 95.00 (psychological level).
- **Resistance:** 96.00 (current price zone), 97.00 (breakout target).
**Conclusion:**
- **Bullish Bias:** Price action and technical indicators favor more upside.
- **Watch for Retests:** A pullback to the breakout zone (around 95.00) could offer buying opportunities.
- **Risk Management:** If price re-enters the rectangle, the breakout may fail, requiring reassessment.

AUDJPY FORECASTI really love the way the higher timeframe is looking. Seeing a complete structure in the lower timeframe allows me to look for the selling potential in the lower timeframe. In this video, I've covered a lot of scenarios on where to look for the potential in this price movement. Let's keep it in watch and see what will be happening

AUDJPY Cis under correction to uptrend AUDJPY is undergoing correction and given 4 hr brake out of the trend and soon may rise to 95.5.

AUD/JPY: Testing Key Downtrend as Bulls Eye 50DMA BreakAUD/JPY is testing downtrend resistance established in November, with a potential retest of the 50DMA in play. Momentum indicators, including RSI (14) and MACD, are flashing bullish signals, favouring an upside bias near-term.
If we see a break of the downtrend and minor horizontal support at 95.35, longs could be established above the latter with a stop beneath for protection. The 50DMA has repeatedly capped bullish attempts recently, making it a key hurdle—those entering should be prepared to cut if the price fails to break and close above it.
If cleared, 97.33 emerges as a potential target, with 97.96 and 99.10 as other topside levels to watch. A failure to sustain the breakout would invalidate the bullish bias.
Good luck!
DS

AUDJPY LongAUDJPY is now net long on the regression break.
There is positive roll on this pair long the commodity pair AUD / CAD / NZD vs JPY are joining the move.
I am considering my options with EAs on these pairs.

Bearish reversal?AUD/JPY is rising towards the pivot which is a pullback resistance and could drop to the 1st support which is a pullback support.
Pivot: 95.54
1st Support: 93.95
1st Resistance: 96.26
Risk Warning:
Trading Forex and CFDs carries a high level of risk to your capital and you should only trade with money you can afford to lose. Trading Forex and CFDs may not be suitable for all investors, so please ensure that you fully understand the risks involved and seek independent advice if necessary.
Disclaimer:
The above opinions given constitute general market commentary, and do not constitute the opinion or advice of IC Markets or any form of personal or investment advice.
Any opinions, news, research, analyses, prices, other information, or links to third-party sites contained on this website are provided on an "as-is" basis, are intended only to be informative, is not an advice nor a recommendation, nor research, or a record of our trading prices, or an offer of, or solicitation for a transaction in any financial instrument and thus should not be treated as such. The information provided does not involve any specific investment objectives, financial situation and needs of any specific person who may receive it. Please be aware, that past performance is not a reliable indicator of future performance and/or results. Past Performance or Forward-looking scenarios based upon the reasonable beliefs of the third-party provider are not a guarantee of future performance. Actual results may differ materially from those anticipated in forward-looking or past performance statements. IC Markets makes no representation or warranty and assumes no liability as to the accuracy or completeness of the information provided, nor any loss arising from any investment based on a recommendation, forecast or any information supplied by any third-party.

AUDJPY - Divergence plus Bullish Break out from parallel channelAUDJPY has broken out from parallel descending channel after printing divergence on MACD. Breakout is also supported by high volume bars suggesting signs of major pullback from support area.

AUDJPY 4H Double BottomThe price already cross the neckline(94.720) of a double bottom, the objective should be around 97.700 but I set 97.0 as my goal because a pivot point around that level. The stop loss is a little below the first support around 93.634 even though the price seems to already be on its way, I guess there is a chance to get in if there is a pullback.

AUDJPY INTRADAY capped by resistance at 94.70Key Trading Level: 94.70
Bearish Scenario:
The overall sentiment remains bearish, aligned with the longer-term prevailing downtrend. Recent price action suggests a sideways consolidation, indicating potential continuation of the downtrend. A bearish rejection from 94.70 could reinforce selling pressure, targeting 92.33 as the first support level, with further downside extending toward 91.18 and 89.60 if bearish momentum strengthens.
Bullish Scenario:
A confirmed breakout above 94.70 and a daily close higher would invalidate the bearish outlook, signaling a potential shift in momentum. If buyers gain control, the next upside targets would be 95.56, followed by 96.60, where further resistance may emerge.
Conclusion:
The 94.70 level is a key pivot point in determining AUDJPY’s next directional move. A rejection at this level would reinforce the bearish outlook, while a breakout higher could indicate a potential trend reversal. Traders should monitor price action around 94.70 for confirmation of the next move.
This communication is for informational purposes only and should not be viewed as any form of recommendation as to a particular course of action or as investment advice. It is not intended as an offer or solicitation for the purchase or sale of any financial instrument or as an official confirmation of any transaction. Opinions, estimates and assumptions expressed herein are made as of the date of this communication and are subject to change without notice. This communication has been prepared based upon information, including market prices, data and other information, believed to be reliable; however, Trade Nation does not warrant its completeness or accuracy. All market prices and market data contained in or attached to this communication are indicative and subject to change without notice.

AUDJPY Buyers In Panic! SELL!
My dear friends,
Please, find my technical outlook for AUDJPY below:
The instrument tests an important psychological level 94.592
Bias - Bearish
Technical Indicators: Supper Trend gives a precise Bearish signal, while Pivot Point HL predicts price changes and potential reversals in the market.
Target - 93.776
About Used Indicators:
Super-trend indicator is more useful in trending markets where there are clear uptrends and downtrends in price.
———————————
WISH YOU ALL LUCK

AUDJPY Will Go Down! Sell!
Please, check our technical outlook for AUDJPY.
Time Frame: 1h
Current Trend: Bearish
Sentiment: Overbought (based on 7-period RSI)
Forecast: Bearish
The price is testing a key resistance 94.552.
Taking into consideration the current market trend & overbought RSI, chances will be high to see a bearish movement to the downside at least to 94.086 level.
P.S
Overbought describes a period of time where there has been a significant and consistent upward move in price over a period of time without much pullback.
Disclosure: I am part of Trade Nation's Influencer program and receive a monthly fee for using their TradingView charts in my analysis.
Like and subscribe and comment my ideas if you enjoy them!
