AUDJPY SHORT FORECAST Q2 W26 D27 Y25AUDJPY SHORT FORECAST Q2 W26 D27 Y25
Professional Risk Managers👋
Welcome back to another FRGNT chart update📈
Diving into some Forex setups using predominantly higher time frame order blocks alongside confirmation breaks of structure.
Let’s see what price action is telling us today! 👀
💡Here are some trade confluences📝
✅Weekly Order Block Identified
✅Daily Order block identified
✅4H Order Block identified
✅15' Order block identified
🔑 Remember, to participate in trading comes always with a degree of risk, therefore as professional risk managers it remains vital that we stick to our risk management plan as well as our trading strategies.
📈The rest, we leave to the balance of probabilities.
💡Fail to plan. Plan to fail.
🏆It has always been that simple.
❤️Good luck with your trading journey, I shall see you at the very top.
🎯Trade consistent, FRGNT X
JPYAUD trade ideas

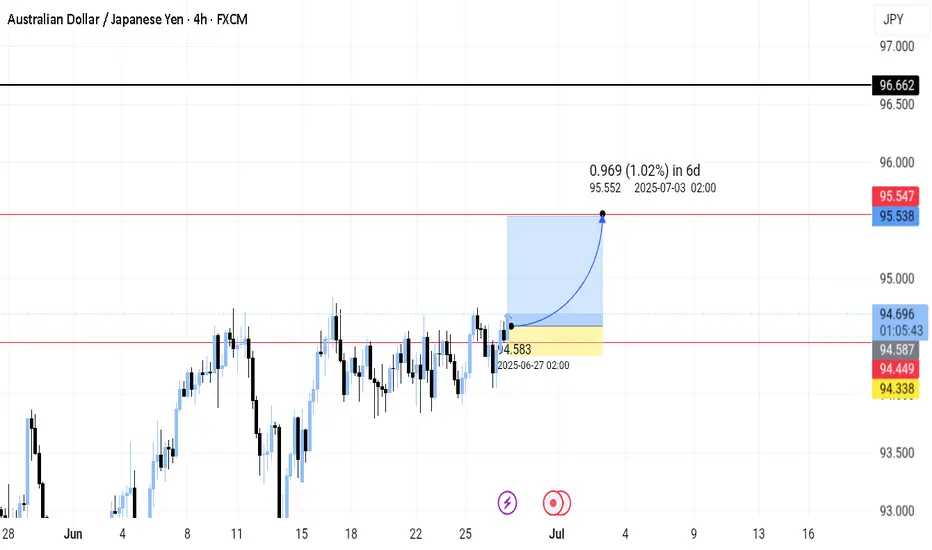
Long Setup – AUDJPY (W Pattern Completion & Shift Confirmation)
Price swept key sellside liquidity at 94.227 and held support just above 94.147. A clean W pattern has now formed with a decisive bullish body close above the shift zone, confirming bullish intent. Entered long with a take profit set at the box equilibrium level of 94.497 and stop loss placed below structure at 94.121. Trade aligns with structure, liquidity engineering, and price reaction from deep discount of the box

AUDJPY WEEKLY HIGHER TIME FRAME FORECAST Q3 W27 Y25AUDJPY WEEKLY HIGHER TIME FRAME FORECAST Q3 W27 Y25
Professional Risk Managers👋
Welcome back to another FRGNT chart update📈
Diving into some Forex setups using predominantly higher time frame order blocks alongside confirmation breaks of structure.
Let’s see what price action is telling us today! 👀
💡Here are some trade confluences📝
✅Weekly 50EMA Rejection
✅Daily Order block identified
✅1H Order Block identified
🔑 Remember, to participate in trading comes always with a degree of risk, therefore as professional risk managers it remains vital that we stick to our risk management plan as well as our trading strategies.
📈The rest, we leave to the balance of probabilities.
💡Fail to plan. Plan to fail.
🏆It has always been that simple.
❤️Good luck with your trading journey, I shall see you at the very top.
🎯Trade consistent, FRGNT X

AUDJPYBreak of structure confirmed. Support turned Resistance and continuation of trend. Long on this!
CHECK AUDJPY SIGNAL READ CAPTAINsell Setup)
Entry Zone: Around 94.650 \94.600
Stop Loss: 94.800
Take Profits:
TP1: ~94.500
TP2: ~94.350
Final Target: 94.100

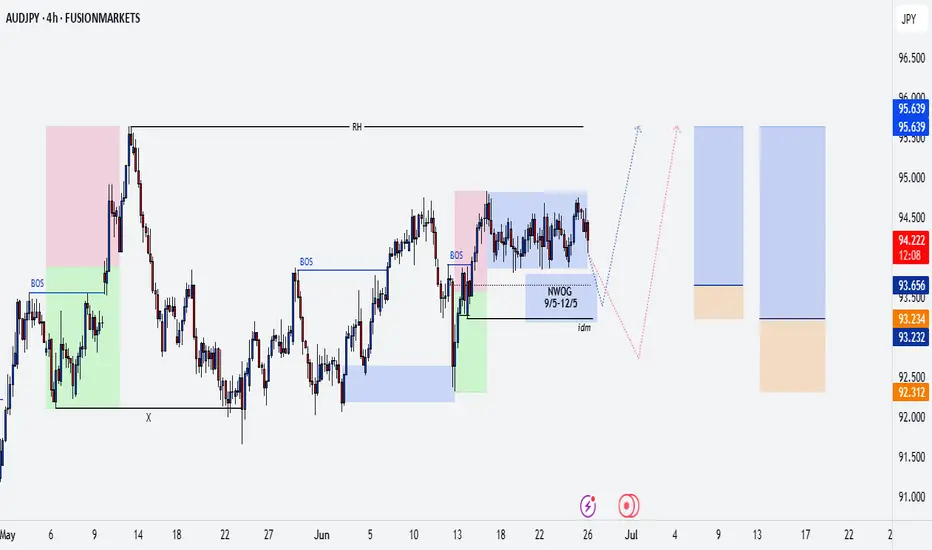
#AJ Long Idea#AJ has been consolidating in 4H bullish structure for more than a month now. also that it is accumulating in 4h (a n algo signature of AMD/PO3) expect a massive outbreak to EQH.
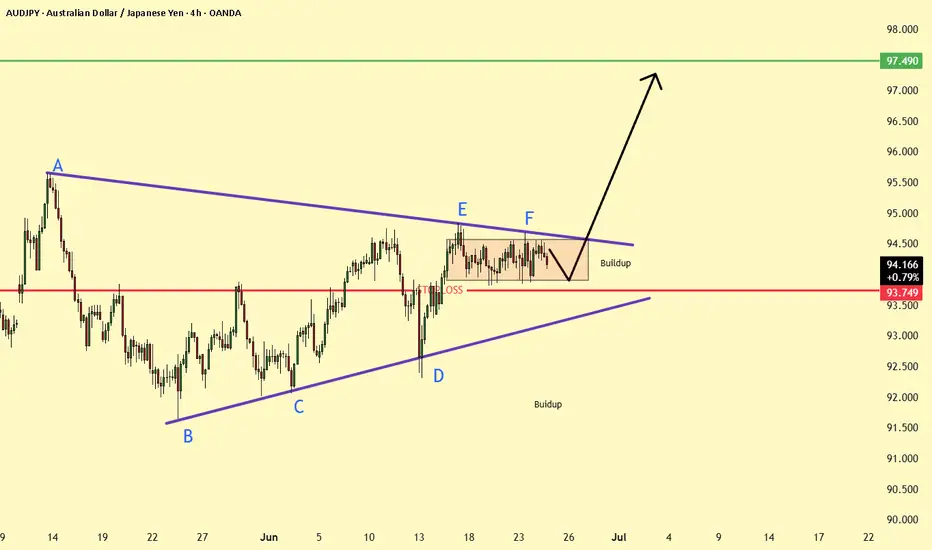
AUDJPY Buildup at Resistance ready for Breakout ?AUD/JPY is forming a symmetrical triangle, currently consolidating near the upper boundary. A successful retest of the support zone (~94.5) followed by strong bullish momentum could lead to a breakout toward 97.5. Watch for confirmation candles and volume spike for entry.
AUDJPY – Extended M Reversal in Box Premium (27/06/25)
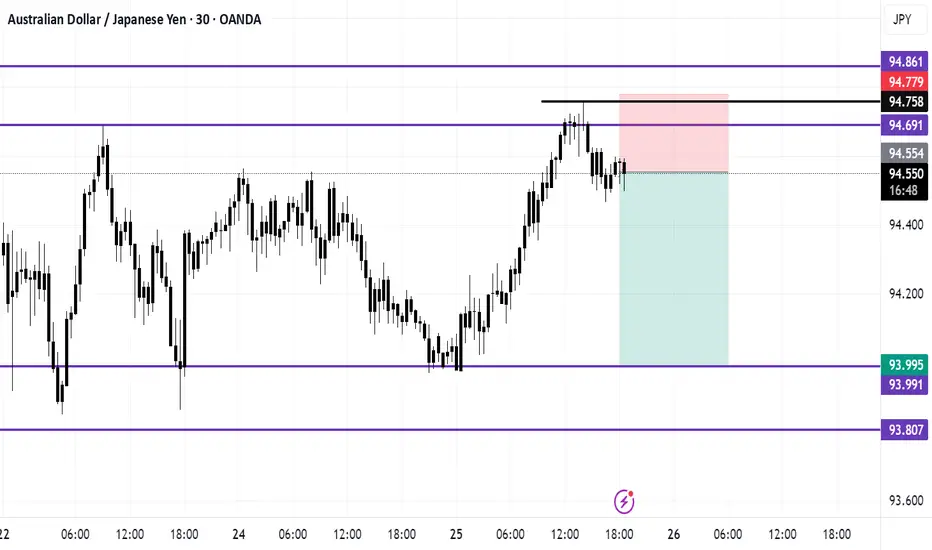
Price swept buyside liquidity at 94.753, forming the second leg of an extended M pattern within the premium zone of the defined box. A clean bearish shift followed, confirmed with a strong-bodied close and short upper wick. Entry was executed post-shift, with confluence from Bright Gold liquidity clusters identified in discount using the HeatMap.
TP set at the box low (94.383), aligning with a major sellside liquidity draw. Stop Loss placed just above the box high, maintaining structure integrity.
Thesis:
- Buyside liquidity sweep + extended M in premium
- Structure shift + bearish intent confirmed
- HeatMap + box theory aligned with short narrative
- Letting price seek liquidity beneath equilibrium
DISCLAIMER: NOT RECOMMENDED TO TRADE SHORT WHEN YOU SEE THIS. MOST OF MOVE IS ALREADY DONE. THIS IS JUST TO PREVIEW AND LEARN THAT TAKING TRADES LIKE THIS CAN BE POSSIBLE

AUDJPY SHORT FORECAST Q2 W26 D26 Y25AUDJPY SHORT FORECAST Q2 W26 D26 Y25
Professional Risk Managers👋
Welcome back to another FRGNT chart update📈
Diving into some Forex setups using predominantly higher time frame order blocks alongside confirmation breaks of structure.
Let’s see what price action is telling us today! 👀
💡Here are some trade confluences📝
✅Weekly Order Block Identified
✅Daily Order block identified
✅4H Order Block identified
✅15' Order block identified
🔑 Remember, to participate in trading comes always with a degree of risk, therefore as professional risk managers it remains vital that we stick to our risk management plan as well as our trading strategies.
📈The rest, we leave to the balance of probabilities.
💡Fail to plan. Plan to fail.
🏆It has always been that simple.
❤️Good luck with your trading journey, I shall see you at the very top.
🎯Trade consistent, FRGNT X

Watch what the market does . The market has hit a resistance and is supposed to sell from there . this is not a financial advise this is for educational purposes only
AUDJPY Under Pressure! SELL!
My dear subscribers,
This is my opinion on the AUDJPY next move:
The instrument tests an important psychological level 94.650
Bias - Bearish
Technical Indicators: Supper Trend gives a precise Bearish signal, while Pivot Point HL predicts price changes and potential reversals in the market.
Target - 94.434
About Used Indicators:
On the subsequent day, trading above the pivot point is thought to indicate ongoing bullish sentiment, while trading below the pivot point indicates bearish sentiment.
Disclosure: I am part of Trade Nation's Influencer program and receive a monthly fee for using their TradingView charts in my analysis.
———————————
WISH YOU ALL LUCK

AUD/JPY at Risk of Breakdown as Bullish Momentum FadesAUD/JPY failed to follow through on a bullish breakout above 94.00, despite initial signs of strength from a bullish hammer and inverted H&S pattern. The pair has since printed a bearish engulfing candle on the daily chart to take prices near the lows of its range of the past week.
With the 1-hour RSI (2) hitting oversold levels, a minor bounce is possible, but risks remain skewed to the downside. A break beneath 93.70 would confirm a range breakdown and open the door to a deeper pullback towards the high-volume node (HVN) at 93.85.
Matt Simpson, Market Analyst at City Index and Forex.com.

SELL AUDJPYSELL AUDJPY. Followed price up this rising trend line to the edge where price created a head and shoulders pattern.
Sell 94,5
TP 93,986 & 93,864
Structure Pattern: Cup and Handle (inverted)
Entry Model: Head and Shoulders

RBA in focus: AUD JPY to continue up? It's a week bereft of major US data. In the main it'll be up to the 'risk environment' to determine proceedings (which currently means tariff headlines).
But we do have the RBA and RBNZ rate decisions to potentially create opportunities.
First up, during Tuesday's Asian session is the RBA, a central bank with a preference for high interest rates (hawkish).
*Reminder: (risk environment aside) high interest rates 'generally' equals strong currency.
Analyst concencious is for a 0.25bp cut.
I can envision two scenarios:
A rate cut with 'hawkish narrative' (non or limited cuts on the horizon).
No rate cut (hold), with data dependent forward guidance.
Both scenarios 'should' be AUD positive. Possibly creating another AUD JPY long trade.
Of course, especially after Friday's NFP, we know that anything can happen and the RBA could deliver a 'dovish cut'. But considering inflation is still relatively high in Australia, I would be surprised with that outcome.
And, of course, a lot depends on the overall 'risk environment'. We could very well have 200% tariffs across the board in 12 hours time. And I would only long the AUD in a 'positive risk environment'.
*Side note: With the S&P 'near all time highs', it's only natural that it could pull back a little. So, I'm more focused on the actual narrative at the moment rather than correlations.
**Second side note: I'm slowly starting to revisit the ' buy / sell stop anticipation trade'. And arguably, an 'AUD long' pre-rate decision is viable. (Whereby you place an 'AUD long' stop order pre event, if it's a dovish outcome the order doesn't trigger). It's not something I endorse in a 'live account' but it's a strategy worth considering. Particularly as I suspect 'red flag' US releases could become important moving forward.
Ultimately, no matter the type of trade you take, it's very important to remember that 50% will hit profit and 50% will stop out. That's why we use a higher risk/ reward per trade.

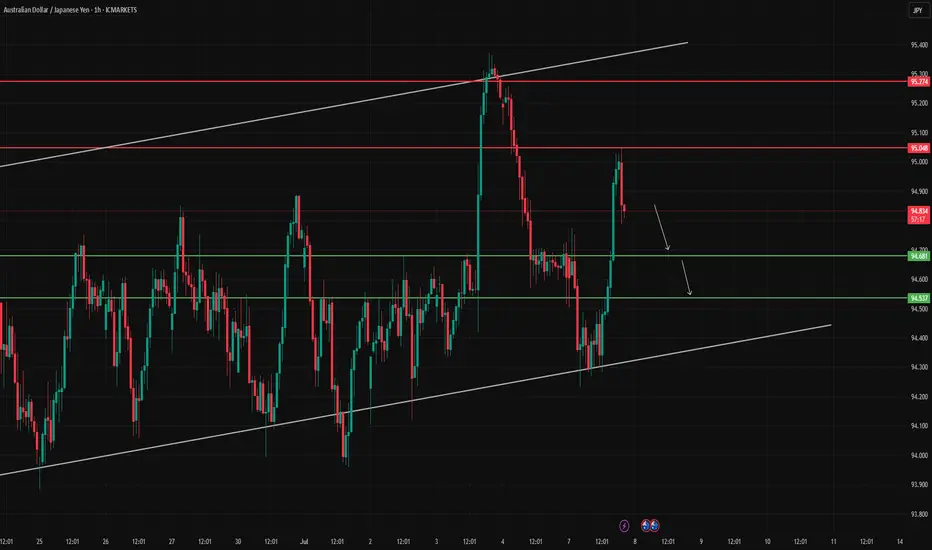
AUDJPY Rejected Key Resistance – Eyes on Downside TargetsThe AUDJPY pair faced rejection from the 95.048 resistance zone, showing potential for a bearish move. If this level continues to hold, price may slide toward the next key support levels at 94.681 and 94.537.
⚠️ Invalidation: A break and hold above 95.274 may cancel the bearish scenario.
This idea is for educational purposes only.
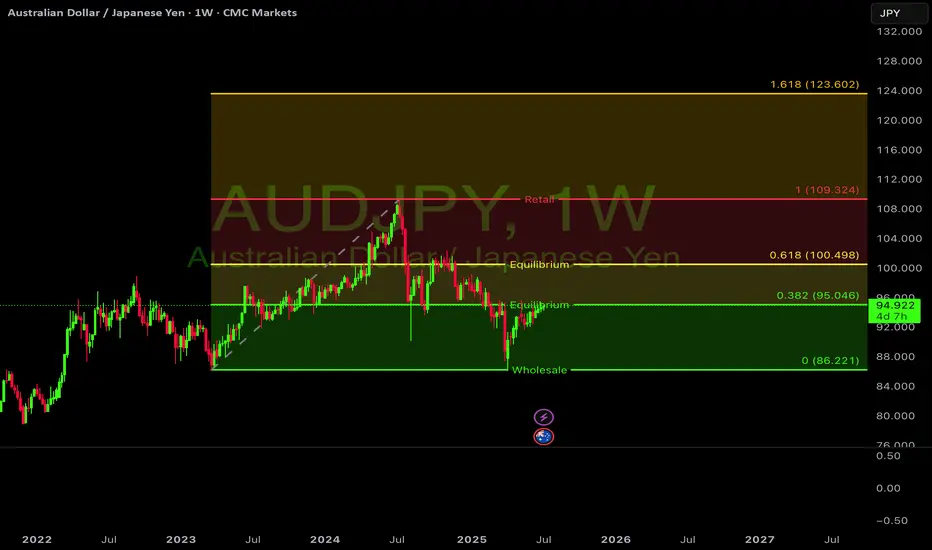
AUDJPY LONG????OANDA:AUDJPY showing resilience at channel support (94.50).
Multi-year uptrend intact with price bouncing from lower boundary. Current consolidation above 94 suggests strength.
Watch for continuation toward 100 resistance. #forex #technicalanalysis

Live trade: AUD JPY long 84.72
20 pip stop loss, 25 pip profit target
The AUD started the week under pressure as the US president singled out the BRICS nations tariffs. (The AUD falling in sympathy with china).
It has since been telegraphed that in general, tariff negotiations are going well, the market is expecting good news. And any 'risk off' moves are reversing.
Arguably, any currency could be traded Vs the JPY as a 'risk on' trade. I've chosen the AUD as it currently has short term momentum Vs the other currencies.
It's a 20 pip stop loss with 25 pip profit target 1.2: 1 risk reward.
The risk to the trade is negative sentiment (probably caused by negative tariff news). Or the fact there isn't a swing to speak of the hide the stop loss behind.
If the trade is still ongoing, I will closed the it before the RBA interest rate meeting to avoid holding risk during the event.

AUDJPY bullish continuation for expect
OANDA:AUDJPY we are have strong bullish push from 22.April, price is start reversing from 14.5., currently how looks price is find ground on strong zone 92.100, based on PA what can see we will have strong bullish push here.
SUP zone: 92.550
RES zone: 95.500, 96.300

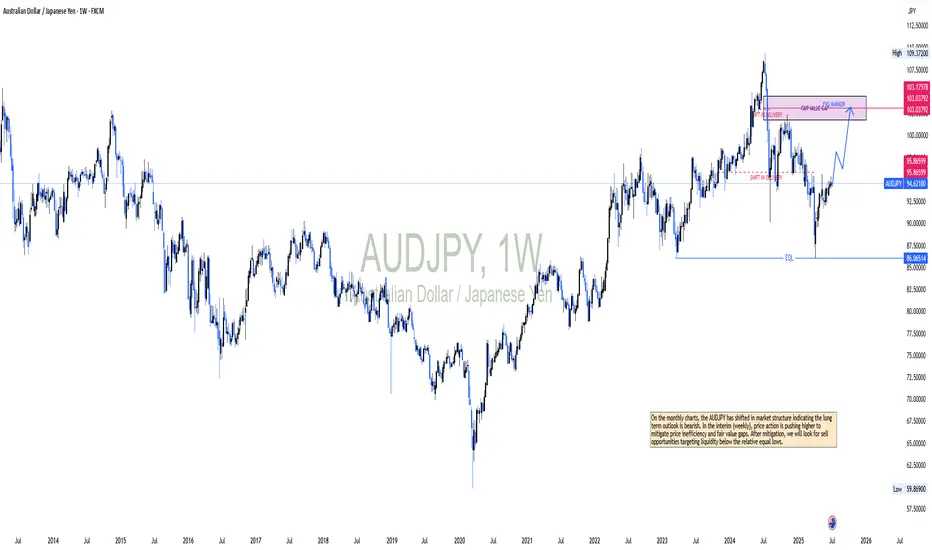
AUDJPY OUTLOOKOn the monthly charts, the AUDJPY has shifted in market structure indicating the long term outlook is bearish. In the interim (weekly), price action is pushing higher to mitigate price inefficiency and fair value gaps. After mitigation, we will look for sell opportunities targeting liquidity below the relative equal lows.
AUD/JPY LONGAUD/JPY LONG "break of a resistance area and retest + 61.8% fib retracement + 50 ema dynamic support "

AUDJPY SELLBy utilizing levels, historical patterns, , we can formulate a hypothesis that the market might follow a similar trajectory if bearish sentiment prevails.

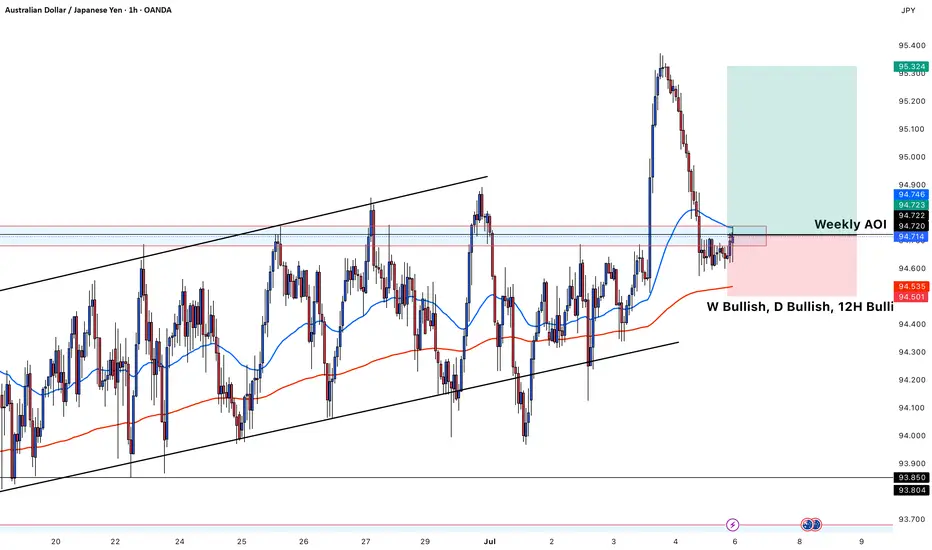
chart shows a Long setup on AUD/JPY based on multi-timeframeThis chart shows a **buy setup on AUD/JPY** based on multi-timeframe bullish confluence and a key structure level. Here's a breakdown of the idea:
---
### 🟢 **Trade Type:** Buy
### 📈 Pair: AUD/JPY (1H Chart)
---
### ✅ **Technical Confluences:**
* **Trend Bias:**
* **Weekly (W): Bullish**
* **Daily (D): Bullish**
* **12H: Bullish**
* **Structure:**
* Price retraced into a **Weekly Area of Interest (AOI)** marked in blue and red zone.
* It bounced off the lower trendline of the ascending channel.
* Price is currently forming higher lows near the support of the AOI.
* **Indicators:**
* The **50 EMA (blue)** and **200 EMA (red)** are holding as dynamic support, especially the 200 EMA just below current price.
* EMAs show bullish alignment (short-term EMA above long-term EMA).
* **Candle Action:**
* Price rejected the AOI and is trying to push higher.
* The bullish engulfing near the EMA zone confirms buy interest.
---
### 🟦 **Entry Zone:**
* Around **94.70–94.72**, aligned with the Weekly AOI and just above 200 EMA.
### 📍 Stop Loss:
* Below the red support zone, around **94.50–94.53**, under 200 EMA and key rejection wick.
### 🎯 Take Profit:
* Around **95.30–95.32**, targeting the previous swing high for a favorable risk-reward ratio.
---
### 📊 Summary:
This is a bullish continuation trade, buying from a retracement into a strong support zone with higher timeframe bullish structure and clear confirmation through price action and EMA alignment.