AUDJPY setup for sell base on Technical Analysis* 4hr order-block
* 4hr inversion
* Double equal Liquidity in down side
* trend is bearish.
JPYAUD trade ideas

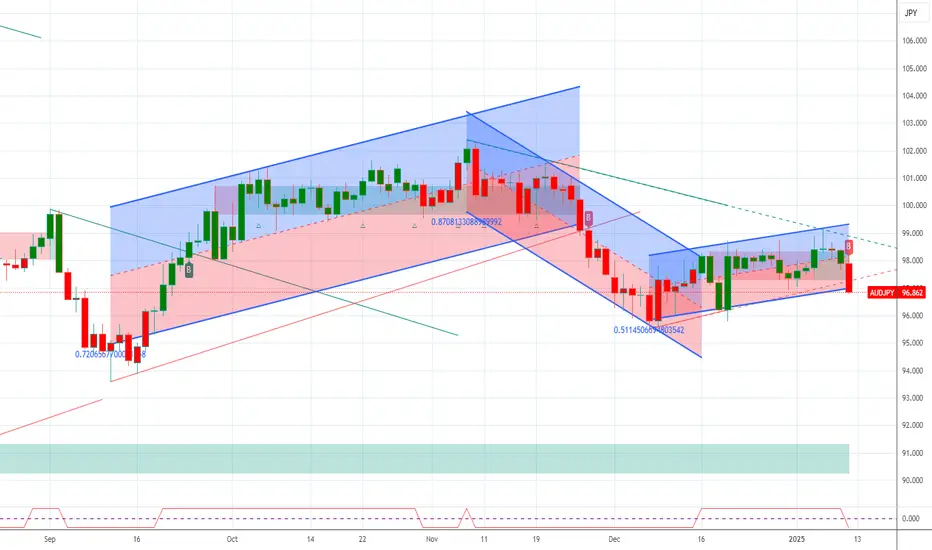
AUDJPY Upside Expected Towards 1Y PivotHello,
OANDA:AUDJPY is likely to continue its upward movement toward the 1-year pivot point (1Y PP) in the near future. As long as the price stays above the 1-month pivot point (1M PP), further gains can be anticipated.
No Nonsense. Just Really Good Market Insights. Leave a Boost
TradeWithTheTrend3344

AUDJPY possible SELL opportunity on the daily chart using PVSRAAUDJPY is going down and will probably continue this move in the next few days.

AUDJPY 4D Market IdeaPotential for a bearish pullback on the AUDJPY 4D which could lead to a price movement towards the support level at 85.000

perfect entry for sell base on ICT #AUDJPYperfect entry for sell base on ICT AUDJPY
* Order Block
* Fvg in daily
*Market left liquidity down side

AUDJPY swing Trade Idea This is AUDJPY price action breakdown
Give a support If you support the idea

audjpysell to target 96.200
and Sl 98.500
Capital management should be observed
Pay attention to today's and tomorrow's news

audjpy buy signal. Don't forget about stop-loss.
Write in the comments all your questions and instruments analysis of which you want to see.
Friends, push the like button, write a comment, and share with your mates - that would be the best THANK YOU.
P.S. I personally will open entry if the price will show it according to my strategy.
Always make your analysis before a trade

AUD/JPY long: Aussie kicks like a kangaroo-unexpectedlyHello traders
Best wishes for a prosperous and low stress 2025.
I purposely waited for the recent USD NFP print to enter into any meaningful trade. The USD/JPY reaction is what I was looking for. It is turning up and this rising tide has lifted all the major JPY cross boats.
I have initiated a long AUD/JPY position at 96.962.
FUNDAMENTAL REASONS:
BoJ Governor Ueda has left the door open to a rate hike on the Jan 24th BUT left an escape route by referencing the need to evaluate data. FOMC Chair Powell has taught him well :)
Keep an eye on Deputy Governor Himino's speech and especially press conference on 1/14/2025.
The RBA statement in December unexpectedly took on a dovish tone which expedited the expected but not confirmed rate cut from March to February 2025.
ECONOMIC calendar JPY:
1/23/25 National Core CPI
1/23-24/2025 BoJ rate decision
ECONOMIC calendar AUD:
1/15/2025 Employment change. And this is the "kicker". Australian employment change expectations in general can be significantly off mark. If it comes in strong, the RBA may reconsider the need to cut rates. Same for CPI and PPI.
1/28/2025: CPI
1/30/2025: PPI
2/18/2025: RBA Rate decision
TECHNICAL analysis:
AUD/JPY shows three consecutive higher weekly closes. And closed on the 100 week MA
the 4 hour chart shows the retest of the weekly 96.82 breakout level higher.
INDICATORS: RSI, UO and ADX are all turning up.
The pair is also in an ascending channel.
My favorite part of this trade is that the downside should not be a significant hit if the stop is just below 96.82.
However, do you own research. As always, I invite feedback.
Best of luck.

AUDJPY LOOK POISED TO GO UPI will look forward to price sweeping the liquidity before making a push upward.

Is the bear market bounce in the AUDJPY over? 16 Risk Reward!Hello!
Here is my fundamental case to be short AUDJPY
1) Strengthening economy in Japan
- Is Japan finally out of its 30 year lul?
2) Weakening Economy in Australia
- Are interest rates finally starting to effect the economy?
3) Extreme household debt in Australia due to the extreme property hype cycle (People say its because of immigration, I think this is just a narrative... I remember when Hong Kong 'didn't have enough space') Australia hast had its 2008 moment yet,
4) Debt is on govt balance sheet in Japan already... Australia will probably join the govt debt club once they have their property cycle FINITO.
Here is my technical case to be short AUDJPY
1) We have rallied to the 61% Fibonacci of the first impulse down.
2) The 'False breakout' at 102ish gives us a good level to know we are wrong. This helps to provide a RIDICULOUS risk reward of 16:1.
Thanks
Kavi

AUDJPY Short on Regression BreakAUDJPY is indicating a short bias on the regression break. It is near the bottom of the consolidation at that has run for some time.
I will not take this trade, as there are other opportunities building.
audjpy analysis in daily timeSelling pressure is very high and the probability of testing the lower areas is very high
ENTRY:97_107
SL:109.950
TP:78.430

Trading Plan: AUD/JPY Monthly Sell Opportunity
### **Trading Plan: AUD/JPY Monthly Sell Opportunity**
#### **1. Market Analysis**
- **Timeframe:** Monthly
- **Trend Direction:** Analyze the previous 12-24 months' candles to determine the dominant trend.
- **Key Levels:**
- Last Month's High (LMH)
- Last Month's Low (LML)
#### **2. Identify Key Levels and Defense Zone**
- **Last Month’s High:** Mark the high of the previous monthly candle on the chart.
- **Fibonacci Vibration Grid (FVG):**
- Use the Fibonacci retracement tool from the recent swing low to swing high or vice versa to plot the FVG levels.
- Look for overlapping FVG zones above the last month’s high.
- **Defense Zone:**
- This is a resistance area formed by overlapping FVG levels and key price action zones.
- Ensure the defense zone aligns with institutional order blocks or liquidity voids.
#### **3. Entry Conditions**
- **Sell Trigger:**
- Price must enter the area above last month’s high and into the identified defense zone.
- Confirmation via bearish price action patterns (e.g., bearish engulfing, pin bar, or inside bar formations).
- Look for rejection or significant wick formations in the defense zone.
#### **4. Risk Management**
- **Stop Loss (SL):**
- Place the SL slightly above the defense zone or the nearest swing high.
- **Take Profit (TP):**
- Set TP levels using:
- Last Month’s Low (LML) as the primary target.
- Extend TP to key support zones below LML if momentum supports further downside.
- **Risk-to-Reward Ratio (RRR):**
- Maintain a minimum RRR of 1:3.
#### **5. Additional Confluences**
- **Last Line of Defense (LLD):**
- Identify the LLD as the highest resistance point above the LMH where price may reverse.
- Ensure it coincides with the FVG overlap and an institutional order block.
- **Volume Analysis:**
- Use the Volume Profile or On-Balance Volume (OBV) to assess institutional activity in the sell zone.
- **Indicators (Optional):**
- RSI divergence: Look for bearish divergence when price approaches the defense zone.
- Moving Averages: Check for alignment with the bearish trend.
#### **6. Execution Plan**
- Wait for price to approach and react within the defense zone.
- Observe confirmation on lower timeframes (e.g., daily or 4H) for better precision in entries.
- Scale into the position if the market provides multiple rejection points within the zone.
#### **7. Monitoring and Adjustments**
- Reassess the trade if price closes above the defense zone on the monthly timeframe.
- Trail the stop loss using key resistance levels or moving averages if the trade moves significantly in your favor.
?

AUDJPY - Short SetupMy main trading principle is that the price always moves from swept liquidity levels to untouched liquidity levels.
In particular case we clearly can see the following context: price swept 1D and 1W key liquidity level and left untouched level lower, this indicates on probable distribution Wyckoff range.
But to take more statistically probable trades we should wait for some type of lower timeframe confirmation, and in this case we can notice sign of weakness (reaching the middle of the range), so potentially there is a higher probability to see price lower.
Your success is determined solely by your ability to consistently follow the same principles.

AUDJPY Potential UpsidesHey Traders, in today's trading session we are monitoring AUDJPY for a buying opportunity around 96.300 zone, AUDJPY is trading in an uptrend and currently is in a correction phase in which it is approaching the trend at 96.300 support and resistance area.
Trade safe, Joe.

Evening Forecast 10//01/2024Hello! this is my evening forecast for 10/01/2024. Going through my main pairs and the DXY

AUDJPY Possible Bullish Continuation Price forming HH and HL. Price broke previous resistance on the daily and now on support on the 4hr which created HH and HL indicating a bullish pattern and Possible continuation.
Risk Management Very Important.

AUDJPY ALERT!AUDJPY ALERT!
AMD pattern confirmed on the Weekly chart!
GET READY FOR A BIG DROP!
Stay alert and prepared for a potential sharp decline!
Follow our updates for timely analysis and trade signals!

AUDJPY: Bullish Continuation is Highly Probable! Here is Why:
Our strategy, polished by years of trial and error has helped us identify what seems to be a great trading opportunity and we are here to share it with you as the time is ripe for us to buy AUDJPY.
❤️ Please, support our work with like & comment! ❤️

AUD/JPY Trendline Breakout Play!Hey traders, I’m sharing a live trade I’ve just entered on the AUD/JPY pair. Let’s dive into the details, step by step, so you can see exactly why I took this trade and how I’m managing it. 🔥
First, take a look at this beautiful uptrend line I’ve drawn. The price has been respecting this line perfectly, forming higher highs and higher lows, which shows us that the bulls are still in control. 🐂
Right now, the price has bounced off this trendline, and that’s where I entered Long at 98.448.
Why did I take this trade?
1️⃣ Trendline Support: The price bounced from a key support zone.
2️⃣ RSI Confirmation: The RSI is above 50, showing bullish momentum.
3️⃣ Clear Risk/Reward: This setup offers a solid risk-to-reward ratio, which is always part of my trading plan.
Here’s the full breakdown:
Entry Point: 98.448
Stop-Loss (SL): 97.976 (just below the trendline and the last swing low).
Take Profit (TP): 98.870 (a key resistance zone and a logical target for this move).
Risk-to-Reward Ratio: ~1:2
If the price hits my TP, it’s a solid win! If it hits my SL, I’ve kept the loss manageable, as always. 💼
So now it’s a waiting game, but I’m confident in this setup. What do you think? Will the price reach my target? Let me know your thoughts in the comments below, and don’t forget to like and subscribe for more live trades and market insights! 🙌
Disclaimer
This content is for educational purposes only and should not be considered financial advice. Trading involves risk, and you can lose more than your initial investment. Always do your own research and consult a professional before trading.

AUD/JPY LongMarket Analysis:
Asset: AUD/JPY
Timeframe: 1-Hour
Bullish Divergence: Observed on the 1-hour RSI, indicating a potential reversal.
Trendline Breakout: Price is testing a downward trendline, hinting at a possible breakout to the upside.
4-Hour Trend: Confirmed bullish trend, providing higher timeframe confluence for the long setup.
Trade Setup:
Entry Point:
Enter a buy position on the breakout and close above the trendline with confirmation.
Stop-Loss:
Place the stop-loss below the recent swing low or key support zone around 97.50.
Take-Profit Levels:
TP1: 98.98 (prior resistance zone).
TP2: 99.55 (further resistance and psychological level).
Risk Management:
Position Size: Use proper risk management, risking no more than 1-2% of your trading capital.
Risk-Reward Ratio: Aim for at least a 1:2 R/R ratio for this setup.
Additional Confirmation:
Volume Analysis: Look for an increase in buying volume during the breakout.
RSI: Ensure RSI remains above 50 to confirm bullish momentum.

BSL sweep H4 on AUDJPYAs you can see price respects H4 supply and formed BSL Swept and MSS. I will take a short position at the OB zone and target the nearest SSL for the take profit. That’s all and good luck!
