AUDJPY Buyers In Panic! SELL!
My dear friends,
AUDJPY looks like it will make a good move, and here are the details:
The market is trading on 98.841 pivot level.
Bias - Bearish
Technical Indicators: Supper Trend generates a clear short signal while Pivot Point HL is currently determining the overall Bearish trend of the market.
Goal - 98.129
Recommended Stop Loss - 99.245
About Used Indicators:
Pivot points are a great way to identify areas of support and resistance, but they work best when combined with other kinds of technical analysis
———————————
WISH YOU ALL LUCK
JPYAUD trade ideas

AUDJPY ConsoldiationAUDJPY price moves between 97.45 _ 98.70 levels. Now most likely bears will retest support level and then we should wait for some bullish signal on lower timeframe to enter long position.

AUD/JPY (15-Minute Chart)Anticipating price retracement to mitigate the DEC OB or SMT zone, followed by bearish continuation targeting lower lows. Extreme OB serves as an alternative rejection area.
Use proper risk management when trading these zones.
#AUDJPY #SmartMoneyConcepts #SMC #OrderBlocks #PriceAction

AUDJPY💡The chart shows technical analysis of the AUD/JPY currency pair on the daily time frame (D1). The price made a strong downward movement (Bearish Impulse) and broke a recent structural level. The analysis indicates a bearish scenario with the search for an entry point after the correction is completed and the downward movement continues. MACD reflects the decline of bullish momentum and the beginning of bearish momentum.
⛔️It is not investment advice for educational purposes only.

AUDJPY - ShortI’m short on this trade. A lot of consolidation recently but momentum failing. Looking for previous liquidity…
Targets: 97.0 / 96.0 / 94.0

SSL sweep on AUDJPYAs you see on Audjpy, the price already reached SSL and demand zone on timeframe H1. Switch to a lower timeframe, I saw Sell side liquidity sweep (SSL) on timeframe M15 and make a market structure shift. I'm planning to take a long position at the BB+OB zone and target the nearest BSL for the take profit. That’s all and good luck!

AUDJPY-SELL strategy 3 hourly chart GANN SQThe pair is slightly on the BUY side short-term, and the pressure is upwards at the moment. we are approaching overbought state, hence I feel we should start a short on it.
Strategy SELL @ 9935-99.55 area and take profit near 98.75 for now.

Analyzing AUDJPY Breakout: A Bullish Opportunity The forex pair AUDJPY is currently trading at 99.000, with a target price set at 100.000. This suggests an anticipated price movement of 100 pips, signaling a potential gain if the trade goes as planned. The price action indicates an ascending triangle pattern, a bullish continuation pattern often associated with upward price momentum. A breakout above the triangle's resistance level has already occurred, confirming the bullish bias. This breakout implies that buyers are in control, increasing the likelihood of reaching the target. The ascending triangle reflects higher lows, showing consistent buying pressure. Traders often view this as a strong technical indicator for upward movement. Risk management is crucial, as market conditions can shift unexpectedly. Monitoring the pair's price action and related economic events is essential. The breakout provides a clear trading opportunity aligned with technical analysis.

Bullish Outlook for AUDJPY: Targeting 98.98 with a Strong Buy SToday, I want to share my bullish analysis on the AUDJPY currency pair. The current market conditions and signals point towards a promising upward trajectory, making this a compelling buy opportunity.
At the moment, I recommend entering a buy position at 98.327. This recommendation is grounded in a blend of technical and fundamental analysis, particularly in line with the principles of the EASY Trading AI strategy, which emphasizes recognizing market patterns and trends. The indicators show strong potential for price appreciation, suggesting that the pair could reach the take profit level of 98.98.
To manage risk effectively, I advocate setting a stop loss at 97.592. This strategic placement allows for a balanced risk-reward ratio while protecting against unexpected market reversals. With the strong long trades percentage noted in recent performance data, it becomes clear that maintaining a bullish stance could lead to favorable outcomes.
In conclusion, for traders looking to engage with AUDJPY, this buy position presents a calculated and informed opportunity to capitalize on potential upward movement in the coming sessions. Happy trading!

Bearish drop?AUD/JPY is rising towards the pivot and could drop to the 1st support.
Pivot: 99.58
1st Support: 98.49
1st Resistance: 100.18
Risk Warning:
Trading Forex and CFDs carries a high level of risk to your capital and you should only trade with money you can afford to lose. Trading Forex and CFDs may not be suitable for all investors, so please ensure that you fully understand the risks involved and seek independent advice if necessary.
Disclaimer:
The above opinions given constitute general market commentary, and do not constitute the opinion or advice of IC Markets or any form of personal or investment advice.
Any opinions, news, research, analyses, prices, other information, or links to third-party sites contained on this website are provided on an "as-is" basis, are intended only to be informative, is not an advice nor a recommendation, nor research, or a record of our trading prices, or an offer of, or solicitation for a transaction in any financial instrument and thus should not be treated as such. The information provided does not involve any specific investment objectives, financial situation and needs of any specific person who may receive it. Please be aware, that past performance is not a reliable indicator of future performance and/or results. Past Performance or Forward-looking scenarios based upon the reasonable beliefs of the third-party provider are not a guarantee of future performance. Actual results may differ materially from those anticipated in forward-looking or past performance statements. IC Markets makes no representation or warranty and assumes no liability as to the accuracy or completeness of the information provided, nor any loss arising from any investment based on a recommendation, forecast or any information supplied by any third-party.

PREVIOUS WEEKLY HIGH LIQUIDITY SWEEP ON AUD/JPYWe have our weekly liquidty sweep in play on AUD/JPY. We also have price clearing the 23% fib levell which according to our trading methods, we look to trade to the 61% fib level which is the targeted zone marked on the chart.

POSSIBLE BUY OPPORTUNITY ON AUDJPYPrice showing signs of strong momentum. We look for the pullback to take the trade.

Bearish drop off pullback resistance?AUD/JPY is rising towards the resistance level which is a pullback resistance and could drop from this level to our take profit.
Entry: 98.53
Why we like it:
There is a pullback resistance level.
Stop loss: 98.90
Why we like it:
There is a pullback resistance level.
Take profit: 97.854
Why we like it:
There is an overlap support level that is slightly above the 61.8% Fibonacci retracement.
Enjoying your TradingView experience? Review us!
Please be advised that the information presented on TradingView is provided to Vantage (‘Vantage Global Limited’, ‘we’) by a third-party provider (‘Everest Fortune Group’). Please be reminded that you are solely responsible for the trading decisions on your account. There is a very high degree of risk involved in trading. Any information and/or content is intended entirely for research, educational and informational purposes only and does not constitute investment or consultation advice or investment strategy. The information is not tailored to the investment needs of any specific person and therefore does not involve a consideration of any of the investment objectives, financial situation or needs of any viewer that may receive it. Kindly also note that past performance is not a reliable indicator of future results. Actual results may differ materially from those anticipated in forward-looking or past performance statements. We assume no liability as to the accuracy or completeness of any of the information and/or content provided herein and the Company cannot be held responsible for any omission, mistake nor for any loss or damage including without limitation to any loss of profit which may arise from reliance on any information supplied by Everest Fortune Group.

AUDJPY Next Move ShortGo through the analysis carefully and do trade accordingly.
RWG 'BIAS for next week (3-1-2025)
Current price: 97.80
"Price seems accumulating for a while,possible scenario to push lower clearing available liquidity before any big move".
"Possible expansion to 97.90 levels,then big displacement to the downside."
Disclaimer: Methods shown are
combination of time and price theory by W.D Gann combined with ICT strategy & other .If my analysis doesnt make sense for some of you feel free to skip ahead,This is a personal strategy developed after years of back-testing making the highest win-rate with high risk-to-reward.
Best of luck
Never risk more than 1% of principal to follow any position.
Support us by liking and sharing the post.

[AUDJPY] Short swing positionBuilding an heavy position for a short swing on this forex pair.
Let's see if we can hold this level ...
Great Trade !


AUDJPY SHORTHI
Trade for most probably the rest of the month and April.
Looking for a sell/short:
* Incomplete structure with B wave currently in play
* Liquidity at the bottom indicated with $$$$ signs
* MACD divergence in 4 HR timeframe
* GAP at 91.529 price level
* Engulfing candle in 1 HR
* Fundamentals showing this might be the start of the YEN strengthening.
Trade with care

AUD-JPY 4HAUDJPY possible Trading opportunity. After the impulsive move, the pair has been in correction phase. A major drop is expected on the pair.

Aud/Spy SELL IdeaAud/Spy is hanging around the resistance area and is in a downtrend on hour 4.
Follow the trend, use risk management and sell when u get a sell signal.
This idea is a trend following sell idea. The trend is down, but you need to trade it small enough to hold it a d sleep without worrying about your account getting blown.
Easy

AUD/JPY Eyes Higher Highs!Hello,
OANDA:AUDJPY is in a bullish trend, steadily climbing toward higher highs. A test of the 1-year pivot point (1Y PP) is on the horizon, and if a breakout and consolidation above this level occur, further upside potential is likely!
No Nonsense. Just Really Good Market Insights. Leave a Boost
TradeWithTheTrend3344

AUDJPY BuysIf price breaks the neckline at 99.5 and continues a new rally to create swing highs we could see 104.00
alternatively price could reject the upside at 99.5 and consolidate
lets see

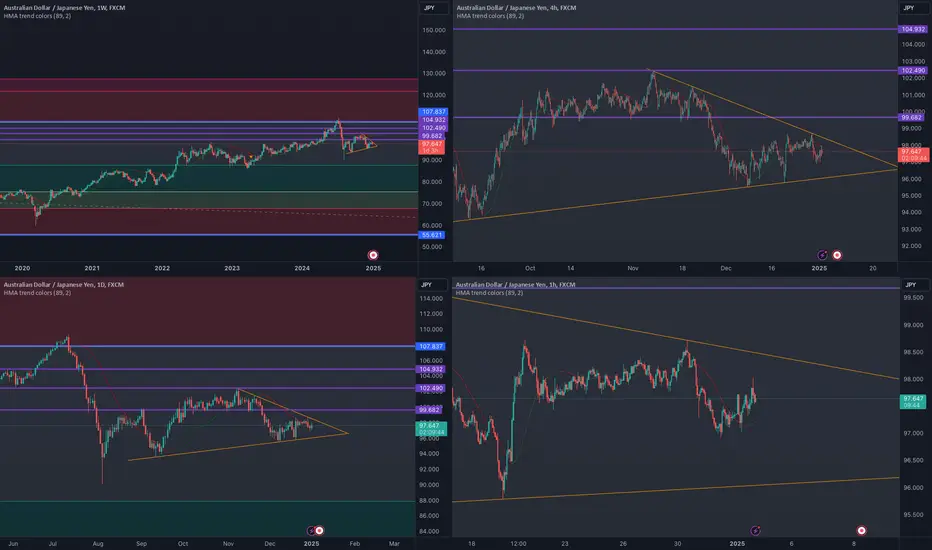
Beautiful triangle waiting for 1K pips+ breakoutA perfect triangle has taken shape in the #AUDJPY chart touching laser sharp on all major candles across multiple timeframes. I first saw this on the 4H chart but it immediately became clear it was clean in all timeframes, with support going even going back to september last year!
This is a very choppy chart, so will wait for breakout in either direction to put a trade on. I could add that the HMA is bearish in all but the lower 1H timeframe, but in this case that gives me no extra information.
Given the significance of this triangle in terms of form and duration, one can expect a large move after breakout. If the breakout about to occur is bullish I will build a position towards the different resistance levels up to the 107.8 region, that is equivalent to 1000 pips! Will take profits along the way, of course.
If bearish, the potential is even greater, targeting first major support in the 88 region with stops along the way, mainly the bottom of the huge pin bar of the 5th August slightly above 90.
AUDJPY is Holding After Channel BreakoutHello Traders
In This Chart AUDJPY HOURLY Forex Forecast By FOREX PLANET
today AUDJPY analysis 👆
🟢This Chart includes_ (AUDJPY market update)
🟢What is The Next Opportunity on AUDJPY Market
🟢how to Enter to the Valid Entry With Assurance Profit
This CHART is For Trader's that Want to Improve Their Technical Analysis Skills and Their Trading By Understanding How To Analyze The Market Using Multiple Timeframes and Understanding The Bigger Picture on the Charts
