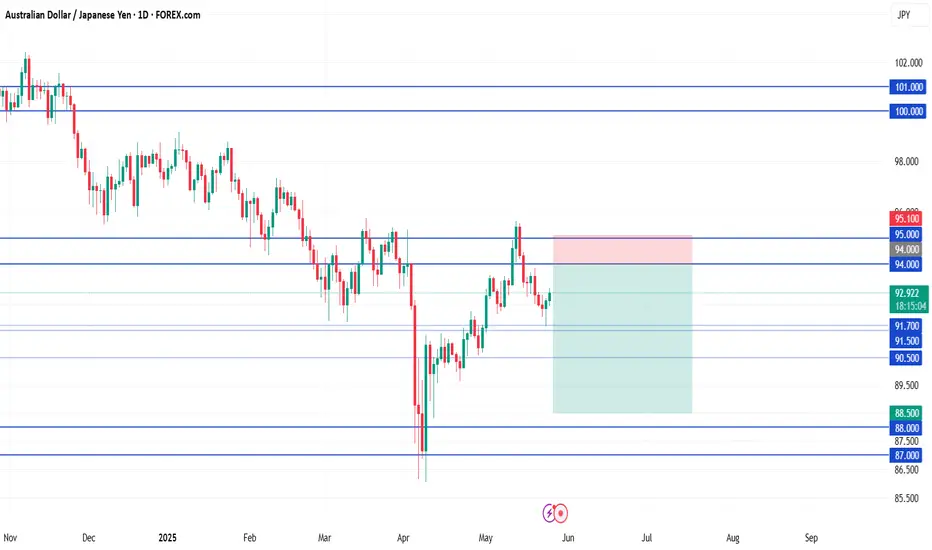
Lingrid | AUDJPY possible WEEKLY High BreakoutThe price perfectly fulfilled my last idea . FX:AUDJPY is holding above its upward trendline after rebounding off support near 93.34, forming a higher low structure. The pair is consolidating just below the resistance zone, suggesting a potential continuation toward the 94.15 target. A break above the recent local high could reignite bullish momentum.
📈 Key Levels
Buy zone: 93.34–93.45
Buy trigger: breakout above 93.80
Target: 94.15
Sell trigger: breakdown below 93.30
💡 Risks
Rejection from 93.80 weakens the upward setup
Drop below trendline support may signal a shift to downside
False breakout above 94.00 could trap early buyers
Traders, if you liked this idea or if you have your own opinion about it, write in the comments. I will be glad 👩💻
JPYAUD trade ideas


AUD/JPY Short📍 AUD/JPY Short Setup – Sell Limit Order
Entry: 94.00
(clean retest of daily + weekly resistance zone, aligned with previous structure)
Stop Loss: 95.10
Take Profit 1: 91.00
(recent support shelf with high reaction probability)
Take Profit 2: 88.50
(strong weekly support zone; ideal mid-term target if momentum continues)
Possible bullish outlook Generally, the market environment for audjpy looks bullish , as prices looks set to take out the 4h major high , so in a minor structure manner towards breaking the major high , we can clearly see price has taken the immediate minor structure high ,I would be watching to see price coming ( retracing) to take out this bullish engineered liquidity into the ob , to fetch more entry as price goes on to clear out the major high


AUD-JPY Will Keep Growing! Buy!
Hello,Traders!
AUD-JPY made a bullish
Breakout of the key
Horizontal level of 93.800
And the breakout is confirmed
So we are bullish biased
And we will be expecting
A further bullish move up
Buy!
Comment and subscribe to help us grow!
Check out other forecasts below too!
Disclosure: I am part of Trade Nation's Influencer program and receive a monthly fee for using their TradingView charts in my analysis.

AUDJPY pull back to FVG then LongAUDJPY Long Setup (Preliminary Plan)
Target Levels:
First Target: 94.300
Second Target: 94.800
Strategy:
Looking for bullish price action (PA) confirmation around the highlighted Fair Value Gap (FVG).
Expecting a possible breach of minor resistance on open, which may lead to a push toward the first target at 94.300.
A pullback may follow after the first target is hit.
Notes:
This setup is preliminary and subject to adjustment.
Live price action will be monitored before executing the trade.

Ideas for AUDJPY trades from Jun-8 to Jun-15/2025This is my AUDJPY trading idea for a week from Jun-8 to Jun-15/2025
Timeframe: D
Setup: BB
Action: We need to wait for the candles accumulated near EMA21

AUDJPY Technical & Order Flow AnalysisOur analysis is based on multi-timeframe top-down analysis & fundamental analysis.
Based on our assessment, the price will rise to the monthly level.
DISCLAIMER: This analysis can change anytime without notice and is only for assisting traders in making independent investment decisions. Please note that this is a prediction, and I have no reason to act on it, and neither should you.
Please support our analysis with a boost or comment!

AUDJPY SellsAUDJPY going into the next couple of weeks looking at a pull back to 97.000 and looking at a Target of 86.000
Have a good week Traders


AUDJPYAUDJPY is approaching a key support level for a potential retest. If the level holds, it could present a high-probability buy setup, with expectations of a bullish reaction from this demand zone

AUD_JPY BULLISH BREAKOUT|LONG|
✅AUD_JPY is trading in a
Local uptrend and the pair
Broke the key horizontal level
Of 93.866 and the breakout is
Confirmed so we will be
Expecting a further
Bullish move up on Monday
LONG🚀
✅Like and subscribe to never miss a new idea!✅
Disclosure: I am part of Trade Nation's Influencer program and receive a monthly fee for using their TradingView charts in my analysis.

AUDJPYAUD/JPY 10-Year Bond Yield, Interest Rate Differential, Uncovered Interest Rate Parity, and Carry Trade Advantage (June 2025)
Uncovered Interest Rate Parity (UIP) explains potential currency movements between the Australian dollar (AUD) and Japanese yen (JPY) by linking the difference in their interest rates to expected changes in their exchange rate.
How UIP Works for AUD/JPY
UIP theory states that the difference in nominal interest rates between two countries equals the expected percentage change in the exchange rate between their currencies over the same period.
If Australia’s interest rates are higher than Japan’s, UIP predicts that the AUD will depreciate against the JPY by approximately the interest rate differential to offset the higher returns investors earn from Australian assets.
Conversely, if Japan’s rates were higher, the JPY would be expected to depreciate against the AUD by the same logic.
Intuition Behind UIP
Investors seeking higher yields may borrow in the low-interest-rate currency (JPY) and invest in the high-interest-rate currency (AUD).
However, the expected depreciation of the AUD against the JPY (equal to the interest rate gap) eliminates the possibility of riskless arbitrage profits, as exchange rate losses offset interest gains.
Thus, the currency with the higher interest rate tends to depreciate, balancing returns across countries.
Real-World Considerations
UIP often does not hold perfectly in practice due to market imperfections, risk premiums, monetary policy differences, and investor behavior.
For example, the Japanese yen is a popular funding currency in carry trades because of its low rates, and empirical studies show UIP deviations in the AUD/JPY market.
These deviations allow investors to earn excess returns by exploiting interest rate differentials, but they carry exchange rate risk.
1. Current 10-Year Bond Yields
Australia 10-Year Bond Yield:
Around 4.3% to 4.5% as of early June 2025, with recent quotes near 4.34% to 4.48%. The Reserve Bank of Australia cut the cash rate to 3.85%, but bond yields remain elevated due to inflation expectations and global factors.
Japan 10-Year Bond Yield:
Japan’s 10-year government bond yield remains very low, typically near 0.3% to 0.5%, reflecting the Bank of Japan’s ultra-loose monetary policy and yield curve control targeting around 0% for 10-year bonds. This yield has been stable due to persistent low inflation and accommodative policy.
2. Interest Rate Differential
The 10-year bond yield differential (Australia minus Japan) is approximately:
4.4%−0.4%=4.0%
This means Australian 10-year bonds yield roughly 4 percentage points more than Japanese 10-year bonds.
3. Uncovered Interest Rate Parity (UIP)
UIP theory suggests the expected change in the exchange rate equals the interest rate differential:E =iAUD−iJPY≈4.0%E =i AUD −i JPY ≈4.0%
This implies the AUD should depreciate by about 4% annually against the JPY to offset the higher yield on Australian bonds.
In practice, however, UIP often fails in the short to medium term due to risk premiums, capital flows, and market sentiment.
4. Carry Trade Advantage
The large positive yield differential creates a strong carry trade incentive: investors borrow in low-yielding JPY and invest in higher-yielding AUD assets to capture the interest rate spread.
Benefits:
Potentially attractive returns from the ~4% yield gap
AUD’s higher yields and commodity exposure can amplify gains in risk-on environments
Risks:
Currency risk if AUD weakens sharply versus JPY
Global risk-off events can trigger rapid unwinds of carry trades, causing AUD depreciation
Summary Table
Metric Australia (AUD) Japan (JPY) Differential (AUD - JPY)
10-Year Government Bond Yield ~4.3% - 4.5% ~0.3% - 0.5% ~4.0%
Policy Rate 3.85% (RBA) -0.1% to 0% (BoJ) ~3.85%
UIP Expected AUD Depreciation — — ~4.0% per annum
Carry Trade Advantage High yield, attractive Low yield, funding currency Strong carry trade incentive
Conclusion
The AUD/JPY pair is strongly influenced by the large interest rate differential, with Australian 10-year bonds offering about 4% higher yields than Japanese bonds. This differential encourages carry trades where investors borrow in low-yielding JPY to invest in higher-yielding AUD assets. According to uncovered interest rate parity, this yield gap should be offset by an expected AUD depreciation against JPY, but in reality, carry trades and risk sentiment often drive deviations from UIP.
#AUDJPY

audjpy head and shoulder patternunderstanding the head and shoulder pattern watch for opportunities as the market goes

AUDJPY Wave Analysis – 6 June 2025
- AUDJPY broke resistance area
- Likely to rise to resistance level 95.30
AUDJPY currency pair recently broke the resistance area between the resistance level 93.75 (top of the previous B-wave from the end of May) and the 50% Fibonacci correction of the downward impulse A from last month.
The breakout of this resistance area should accelerate the active short-term correction B.
AUDJPY currency pair can be expected to rise to the next resistance level 95.30 (which stopped the previous waves 4 and (A)).


AUDJPY – Bearish Bias LiveAUDJPY – Bearish Bias Live
⬇️ Entered short at market open
🎯 Target: 92.53924
⏳ Expect to hold for about one a week (usually hits in within 48 hours)
I’m already running this short—if you’d like to join, be prepared to hold through the week.
💡 All setups can be replayed on TradingView for confirmation.
⚠️ Not financial advice—trade responsibly!
#AUDJPY #Forex #TradingView #SwingTrade #MarketAnalysis

AUDJPY Begins Elliot Correction After Wave 5 Impulse EndsOANDA:AUDJPY seems to have started a Elliot Correction Wave after the Impulsive Elliot Wave came to a finish once Wave 5 ended this morning @ 93.774.
Now after an Impulsive Wave ends, its theory that a Correction comes next and with Price having Retraced to the Golden Ratio creating a Lower High, this is the beginning signs of that theory in the works!
The Sequence will be confirmed once Price Breaks below Point A @ 93.248 where then we should suspect Price to find itself back down into the 92 range where the Correction Wave should come to an end.
RSI is trading back below 50 confirming Price has room to move lower strengthening the Bearish Bias.

AUDJPY SELL OPPORTUNITY Am sell opportunity on AUDJPY
ENTRY : 93.500
SL: 93.625
TP: 92.700
COMMENT YOUR OPINION
FOLLOW ME ON X for Update and Account management @shajudeakinoba1

AUD/JPY SELLERS WILL DOMINATE THE MARKET|SHORT
AUD/JPY SIGNAL
Trade Direction: short
Entry Level: 93.511
Target Level: 93.135
Stop Loss: 93.760
RISK PROFILE
Risk level: medium
Suggested risk: 1%
Timeframe: 1h
Disclosure: I am part of Trade Nation's Influencer program and receive a monthly fee for using their TradingView charts in my analysis.
✅LIKE AND COMMENT MY IDEAS✅

Buy ideaTriangle structure broken and retested on the upside. Would look to buy at retest area and aiming for resistance above. Let me know what you think! Comments and/or suggestion highly appreciated :)

AUDJPY: Pullback Confirmed?! 🇦🇺🇯🇵
There is a high chance that AUDJPY will pull back
from the underlined resistance cluster.
Its false violation, a formation of a bearish imbalance candle
and a breakout of a rising trend line provide strong bearish confirmation.
Goal - 93.185
❤️Please, support my work with like, thank you!❤️
I am part of Trade Nation's Influencer program and receive a monthly fee for using their TradingView charts in my analysis.
