Longs ContinuationLooking to Hold this Trade for a continuation move.
The Canadian dollar shows strength against the Japanese yen, supported by stable oil prices and a firm Canadian economy.
The Japanese yen's weakness, amid decreasing safe-haven demand, further supports a bullish outlook for this pair.
JPYCAD trade ideas

Update on CADJPY set up.On my last post on CADJPY i had it dropping to 100. - 90. Levels, i still believe price is Bearish overall, been holding this trade for a while, im still holding even do price is already giving me signs of a possible reversal on the 102. Level, but i need more confluences, price did hit my Tp1 at the Market Low ( 101.500 ) if price starts breaking the 104. Level then most likely ill change my bias and give my analysis for a possible next move. Right now, im just holding all the pairs I've posted.

Bullish Week For CAD/JPYPrice traded above a short term high of 103.877 and created a Fair Value Gap that signals a possible Bullish Continuation towards the high made on 9 April 2025 of 105.056.
Pairs like AUD/JPY, EURJPY, GBPJPY, and USDJPY also traded into Fair Value Gaps on the 2H Timeframe

CADJPY Potential longsFX:CADJPY
🇨🇦/🇯🇵
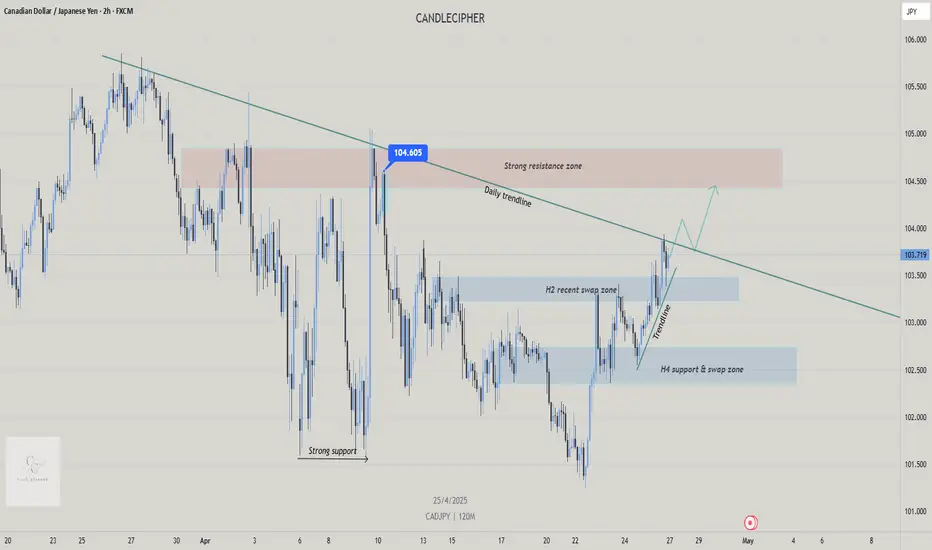
📝 Price spiked by 300 pips after tapping into the strong support on 9 April but lost its momentum shortly after without breaking the daily trendline, suggesting sellers still in control. Price has now reached its daily trendline zone again, on the current price on the day of market close, we see a rejection candle on the 2H chart and slight push upwards.
📝 The buy structures have retraced to its demand zones on each key levels before continuing to push price upwards, forming a compression. If price breaks above the daily trendline and closes above with good momentum, I may expect price to go back and contest the 104.604 candle that gave the bears control for 2 weeks. Therefore, we can use lower timeframe confirmation to hop on buys when price breaks upward and retest.
CAD/JPY 2 Day AnalysisOver March and April 2025, price has been trying to break the 101.50 to 102.00 zone which was support in August 2024.
The last 2 day candle in this area printed as a bullish Hammer candle which was followed by 2 more bullish candles.
We may possibly see price break out above the trendline and buyers taking control of the market.
This is an idea of what may happen. Also use a profitable trading strategy combined with good risk management.

CADJPY: Bearish Continuation & Short Trade
CADJPY
- Classic bearish setup
- Our team expects bearish continuation
SUGGESTED TRADE:
Swing Trade
Short CADJPY
Entry Point - 103.70
Stop Loss - 104.30
Take Profit - 102.64
Our Risk - 1%
Start protection of your profits from lower levels
Disclosure: I am part of Trade Nation's Influencer program and receive a monthly fee for using their TradingView charts in my analysis.
❤️ Please, support our work with like & comment! ❤️

CADJPY Technical Analysis! SELL!
My dear subscribers,
CADJPY looks like it will make a good move, and here are the details:
The market is trading on 103.88 pivot level.
Bias - Bearish
Technical Indicators: Both Super Trend & Pivot HL indicate a highly probable Bearish continuation.
Target - 103.40
About Used Indicators:
The average true range (ATR) plays an important role in 'Supertrend' as the indicator uses ATR to calculate its value. The ATR indicator signals the degree of price volatility.
Disclosure: I am part of Trade Nation's Influencer program and receive a monthly fee for using their TradingView charts in my analysis.
———————————
WISH YOU ALL LUCK

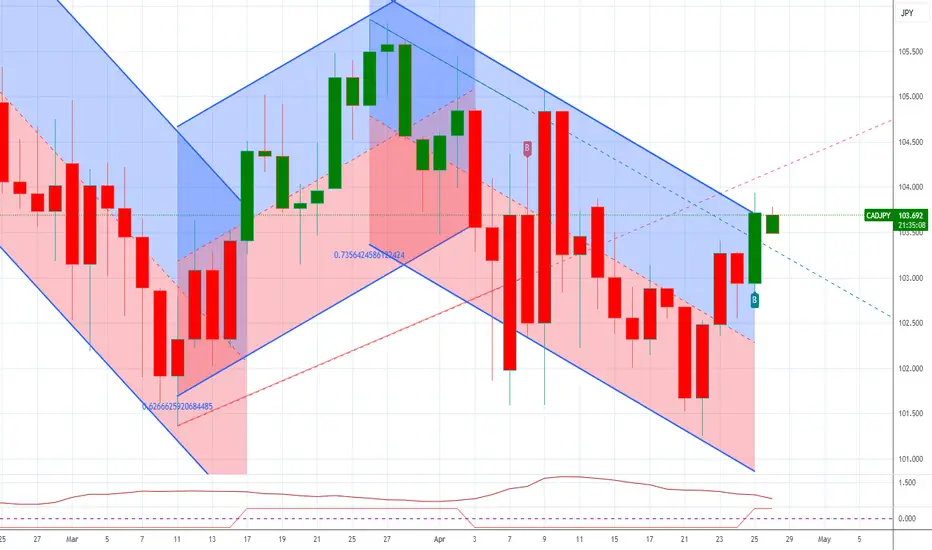
CADJPY: B trade A page from my trading journal. Please take it with a grain of salt, as I’m still learning and growing 🌟
Strength on 4H is real, but structure still early — need a pullback HL and follow-through to confirm trend resumption. No entry at current extended level.

CADJPY - Buy IdeaA bullish RSI divergence has formed on the CADJPY daily (1D) chart at a key resistance level, signaling a potential bullish reversal. Wait for a breakout above the descending trendline, followed by a retest of the trendline, to confirm the entry for a long position.

CAD/JPY for Bullishyou can go now
or
wait for pull-back near by entry point and then go long
general trend is up trend
have fun :)


CADJPY is in Bearish trend.CADJPY started printing series of LH and LL. Its a good time for a short trade and can earn a good amount of money.

CAD/JPY BEARS WILL DOMINATE THE MARKET|SHORT
Hello, Friends!
Previous week’s green candle means that for us the CAD/JPY pair is in the uptrend. And the current movement leg was also up but the resistance line will be hit soon and upper BB band proximity will signal an overbought condition so we will go for a counter-trend short trade with the target being at 101.200.
Disclosure: I am part of Trade Nation's Influencer program and receive a monthly fee for using their TradingView charts in my analysis.
✅LIKE AND COMMENT MY IDEAS✅

CAD/JPY pair may form a long-term BUY trendBased on the analysis, the CAD/JPY pair may form a long-term BUY trend. Based on this analysis, we can try to enter a Buy position with a small risk margin.

CADJPY Wave Analysis – 23 April 2025
- CADJPY reversed from strong support area
- Likely to rise to resistance level 104.00
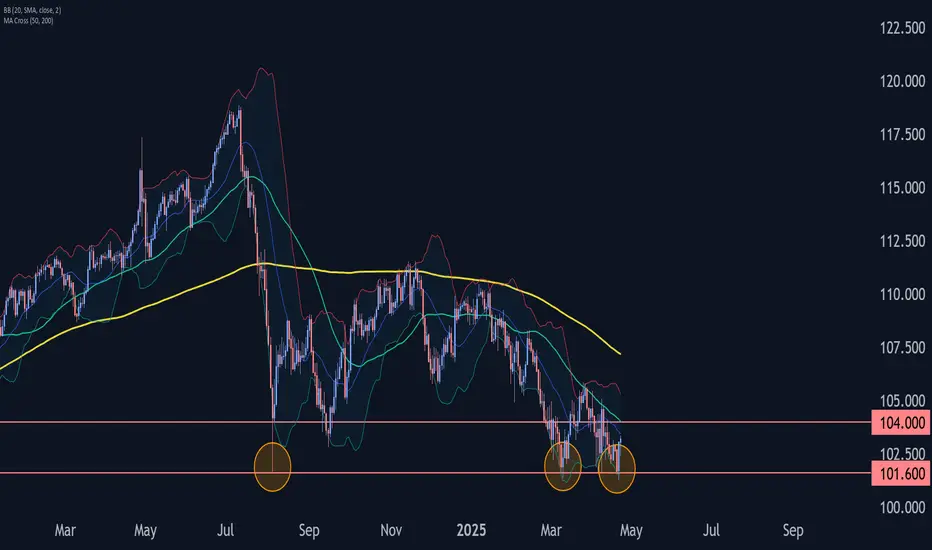
CADJPY currency pair recently reversed from the strong support area between the long-term support level 101.60 (which stopped the sharp downtrend in August of 2024) and the lower daily Bollinger Band.
The upward reversal from this support area created the daily Japanese candlesticks reversal pattern Piercing Line.
Given the strength of the support level 101.60 and the bullish Canadian dollar sentiment seen today, CADJPY currency pair can be expected to rise toward the next resistance level 104.00.
CADJPY 30M TimeFrame BuyWe saw a big bullish move on 30M Timeframe and after a little correction another bullish movement may appear
dont use tight stoploss because of downtrend in higher timeframes.

CAD/JPY we reached bottom levels , great time to collect value!Hi guys we are going to take a look at the CAD/JPY Pair!
Technical analisys -
Currently the pair has reached a bottom level around the 101 zone whichwe can see big support from buyers, additionally the MACD is finishing a down turn momentum formulating a cross over towards an Ascending Channel , the RSI is sitting at neutral / oversold areas on 2H and 4H timeframes
Fundamentals - We are still looking into the monetary policy overlooeked from BoJ and additionally the expected economical data from Canada in the eyes of strong Retail Sales.
📌 Trade Plan
📈 Entry: 101.400
✅ Target 1 : 102.200
✅ Target 2 : 103.100
❌ SL: 100.500
R/R is 1:3

Bullish rebound?CAD/JPY is falling towards the pivot which is a pullback support and could bounce to the 1st resistance which acts as a pullback resistance.
Pivot: 100.55
1st Support: 98.99
1st Resistance: 104.88
Risk Warning:
Trading Forex and CFDs carries a high level of risk to your capital and you should only trade with money you can afford to lose. Trading Forex and CFDs may not be suitable for all investors, so please ensure that you fully understand the risks involved and seek independent advice if necessary.
Disclaimer:
The above opinions given constitute general market commentary, and do not constitute the opinion or advice of IC Markets or any form of personal or investment advice.
Any opinions, news, research, analyses, prices, other information, or links to third-party sites contained on this website are provided on an "as-is" basis, are intended only to be informative, is not an advice nor a recommendation, nor research, or a record of our trading prices, or an offer of, or solicitation for a transaction in any financial instrument and thus should not be treated as such. The information provided does not involve any specific investment objectives, financial situation and needs of any specific person who may receive it. Please be aware, that past performance is not a reliable indicator of future performance and/or results. Past Performance or Forward-looking scenarios based upon the reasonable beliefs of the third-party provider are not a guarantee of future performance. Actual results may differ materially from those anticipated in forward-looking or past performance statements. IC Markets makes no representation or warranty and assumes no liability as to the accuracy or completeness of the information provided, nor any loss arising from any investment based on a recommendation, forecast or any information supplied by any third-party.

CADJPY Possible Sell TradeHere's how I'm watching CADJPY for potential shorts . Trend continuation trade. Do Your Own Analysis.

CADJPY Expected Growth! BUY!
My dear friends,
Please, find my technical outlook for CADJPY below:
The instrument tests an important psychological level 102.02
Bias - Bullish
Technical Indicators: Supper Trend gives a precise Bullish signal, while Pivot Point HL predicts price changes and potential reversals in the market.
Target - 102.88
Recommended Stop Loss - 101.50
About Used Indicators:
Super-trend indicator is more useful in trending markets where there are clear uptrends and downtrends in price.
———————————
WISH YOU ALL LUCK

CAD/JPY "Loonie-Yen" Forex Bank Heist Plan (Scalping/Day)🌟Hi! Hola! Ola! Bonjour! Hallo! Marhaba!🌟
Dear Money Makers & Robbers, 🤑 💰💸✈️
Based on 🔥Thief Trading style technical and fundamental analysis🔥, here is our master plan to heist the CAD/JPY "Loonie-Yen" Forex Market. Please adhere to the strategy I've outlined in the chart, which emphasizes long entry. Our aim is the high-risk Yellow MA Line. Risky level, overbought market, consolidation, trend reversal, trap at the level where traders and bearish robbers are stronger. 🏆💸"Take profit and treat yourself, traders. You deserve it!💪🏆🎉
Entry 📈 : "The heist is on! Wait for the MA breakout (104.800) then make your move - Bullish profits await!"
however I advise to Place Buy stop orders above the Moving average (or) Place buy limit orders within a 15 or 30 minute timeframe most recent or swing, low or high level.
📌I strongly advise you to set an "alert (Alarm)" on your chart so you can see when the breakout entry occurs.
Stop Loss 🛑: "🔊 Yo, listen up! 🗣️ If you're lookin' to get in on a buy stop order, don't even think about settin' that stop loss till after the breakout 🚀. You feel me? Now, if you're smart, you'll place that stop loss where I told you to 📍, but if you're a rebel, you can put it wherever you like 🤪 - just don't say I didn't warn you ⚠️. You're playin' with fire 🔥, and it's your risk, not mine 👊."
📍 Thief SL placed at the nearest/swing low level Using the 1H timeframe (103.000) Day / Scalping trade basis.
📍 SL is based on your risk of the trade, lot size and how many multiple orders you have to take.
🏴☠️Target 🎯: 107.000 (or) Escape Before the Target
🧲Scalpers, take note 👀 : only scalp on the Long side. If you have a lot of money, you can go straight away; if not, you can join swing traders and carry out the robbery plan. Use trailing SL to safeguard your money 💰.
CAD/JPY "Loonie-Yen" Forex Market Heist Plan (Scalping / Day Trade) is currently experiencing a bullishness,., driven by several key factors.👇👇👇
📰🗞️Get & Read the Fundamental, Macro, COT Report, Quantitative Analysis, Sentimental Outlook, Intermarket Analysis, Future trend targets..., go ahead to check 👉👉👉🔗
⚠️Trading Alert : News Releases and Position Management 📰 🗞️ 🚫🚏
As a reminder, news releases can have a significant impact on market prices and volatility. To minimize potential losses and protect your running positions,
we recommend the following:
Avoid taking new trades during news releases
Use trailing stop-loss orders to protect your running positions and lock in profits
💖Supporting our robbery plan 💥Hit the Boost Button💥 will enable us to effortlessly make and steal money 💰💵. Boost the strength of our robbery team. Every day in this market make money with ease by using the Thief Trading Style.🏆💪🤝❤️🎉🚀
I'll see you soon with another heist plan, so stay tuned 🤑🐱👤🤗🤩
