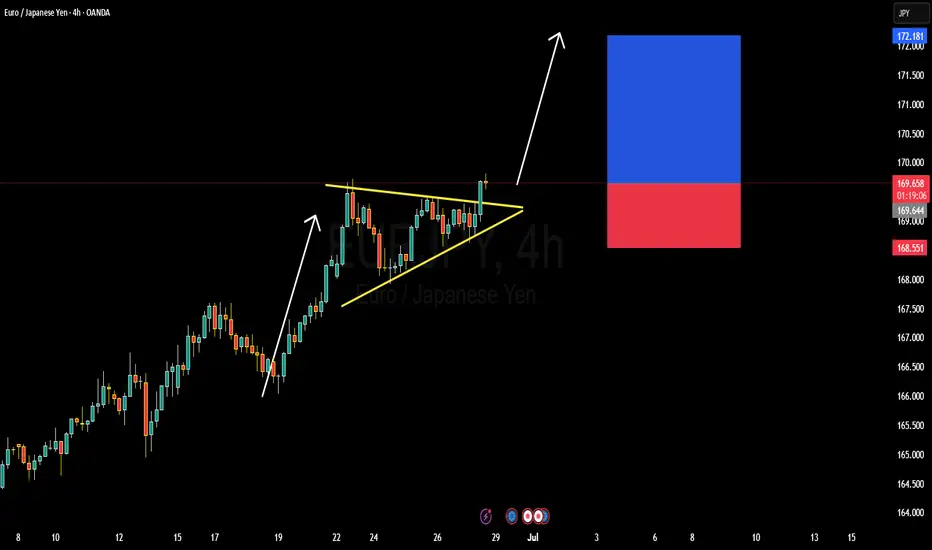
EURJPY BULLISH OR BEARISH DETAILED ANALYSISEURJPY has just broken out of a well-defined bullish pennant pattern on the 4H timeframe, confirming strong continuation potential to the upside. The price is currently hovering around 169.60 after consolidating in a tight structure, respecting both dynamic trendline support and horizontal resistance. This breakout signals renewed bullish momentum, and I'm now targeting the 172.10 zone as the next significant resistance level. The structure is clean, volume supported the breakout, and price action is aligned with the dominant uptrend.
Despite a relatively quiet start to the week—largely influenced by global risk-off sentiment surrounding Middle East tensions—EURJPY has held firm. Now that geopolitical jitters are easing slightly, yen weakness is resurfacing. The Bank of Japan remains firmly dovish, maintaining ultra-loose policy, while the Euro is supported by hawkish commentary from the ECB as inflation in the eurozone remains sticky. This divergence continues to fuel the long-term bullish bias for EURJPY.
Fundamentally, Japanese economic indicators remain soft, and there's still no clarity on when the BoJ will meaningfully shift policy. Meanwhile, EUR zone confidence indicators have stabilized, and speculation is growing around the ECB holding rates higher for longer into Q3. With widening yield differentials and a favorable risk sentiment return, this pair is positioned well for upside movement. Current momentum supports the probability of reaching the 172.00–172.10 area as risk appetite rebuilds across markets.
Technically and fundamentally aligned, EURJPY offers one of the strongest bullish continuation opportunities on the board right now. I will continue to monitor for minor dips as potential add-on areas, aiming for a full extension of the measured move from the pennant formation. Patience pays in setups like this where structure, sentiment, and macro all align.
JPYEUR trade ideas
EUR/JPY Analysis – Flag Breakout Signals Further UpsideHello Traders,
It's been a while. I trust you are good.
Kindly find below my analysis of EURJPY currency pair.
Overview:
EUR/JPY has been consolidating within a bullish flag pattern, characterized by lower highs and lower lows over the past few trading sessions. Price action has now broken above the flag’s resistance, indicating a possible continuation of the broader bullish trend.
Idea:
The breakout above the bullish flag suggests that bulls are regaining control. Price is currently hovering around 169.370, having just cleared the wedge’s resistance line.
Key levels to monitor:
1. Support Zone: Around 169.200–169.300
2. Resistance Level: 169.699
Trade setup:
Entry: On a successful breakout or break and retest of 169.200–169.300.
Stop Loss: Below 168.816 (beneath the flag's support and recent swing low).
Targets: TP1: 169.699, TP2: 170.000–170.200
Conclusion:
EUR/JPY has broken out of a bullish flag pattern, signaling momentum shift in favor of buyers. If price sustains above the breakout zone or clears 169.699 resistance, we may see an extended rally toward the 170.000 mark. Trade with caution.
Cheers and happy trading.

EURJPY MARKET ANALYSIS AND PRICE PREDICTIONEURJPY, has finished consolidating at the intuitional renegotiation zone. Decision has been taken in favor of the Bulls. price has retested the FVG and has given the Bulls a perfect entry now. 174.473 is the target. stop loss should be below the RBN( renegotiation block) at 167.867.
If You have a sizeable account, Hit this one hard, and hold it for a week or two. Don't Forget to send your Tithes.
GOOD LUCK GUYS!
DISCLAIMER
Manage your own Risk. Any analysis can fail due to market sentiments. Take care of your trading capital!

EurJpy rising Wedge Pattern on larger timeframeEur/Jpy rising Wedge Pattern on larger timeframe.
Entry after the break of previous high and the target price will be the consolidation level above it.

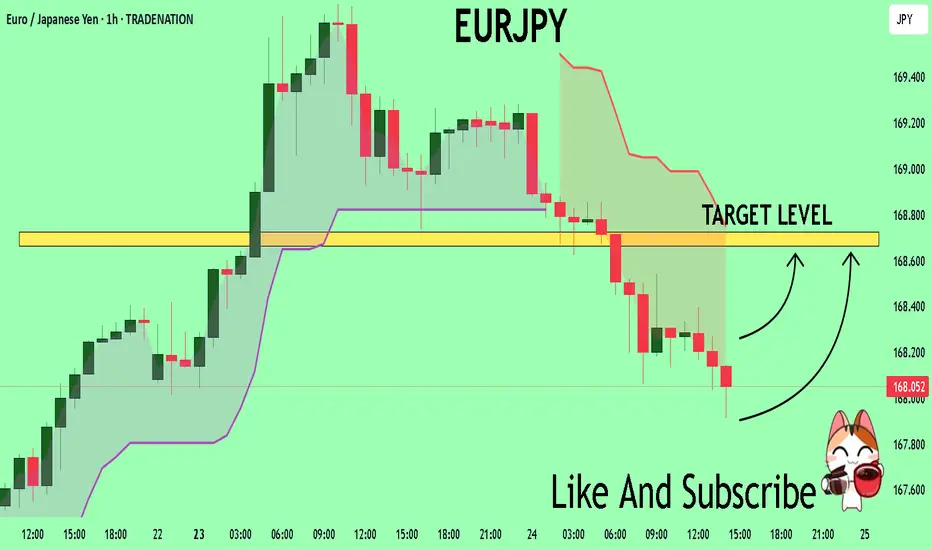
EUR/JPY BEARS WILL DOMINATE THE MARKET|SHORT
EUR/JPY SIGNAL
Trade Direction: short
Entry Level: 169.041
Target Level: 165.789
Stop Loss: 171.204
RISK PROFILE
Risk level: medium
Suggested risk: 1%
Timeframe: 9h
Disclosure: I am part of Trade Nation's Influencer program and receive a monthly fee for using their TradingView charts in my analysis.
LIKE AND COMMENT MY IDEAS

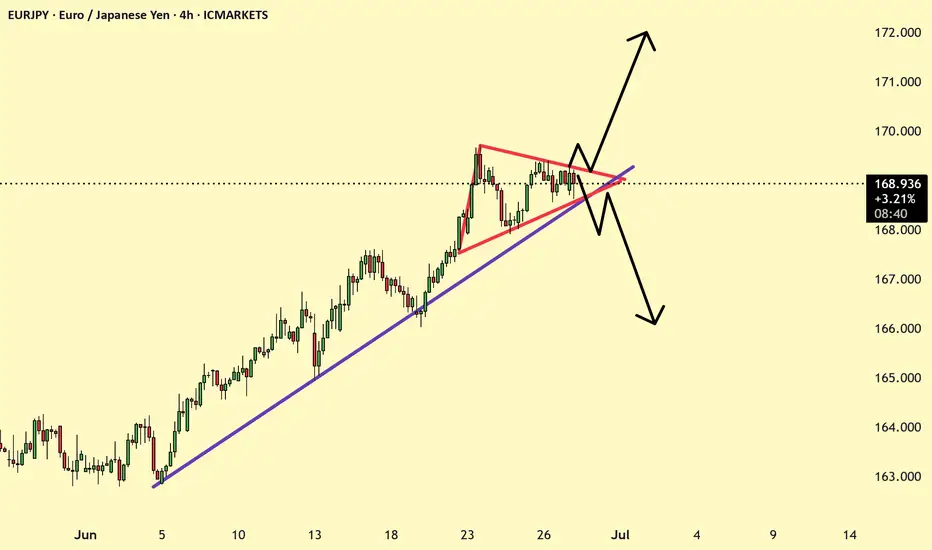
EURJPY possible ScenarioEURRJPY in upward trend currently formed a triangle a breakout may lead it to up and a breakdown of trendline to downward.
EURJPYthe Current EUR/JPY Price price action and directional bias today , EUR/JPY is trading at 169.038 consolidating within a temporary sideways range between 168.60 (support) and 169.659 (resistance). The pair is testing key technical levels amid mixed fundamental drivers.
Eurozone and Japan 10-Year Bond Yields
Eurozone 10Y Bond Yield (EU10Y) 2.561% , reflecting moderate stability despite ECB rate cuts.
Japan 10Y Bond Yield (JB10Y): 1.424% , down slightly from 1.44% from the daily high .
Central Bank Policy Rate ECB) is 2.00% (Deposit Facility) Cut by 25 bps on June 5, 2025, citing inflation at target (2%) and growth projections of 0.9% for 2025.
while BOJ 0.50% (Short-Term) was Held steady on last policy meeting by top boj leadership brass.BOJ signaled slower bond-purchase reductions in 2026 amid fiscal concerns and market volatility.
Interest Rate Differential and Carry Trade Dynamics
Rate Differential: +1.50% (ECB’s 2.00% vs. BOJ’s 0.50%), favoring EUR-funded carry trades.
Bond Yield Spread: +1.13% (EU10Y 2.56%% vs. JB10Y 1.43%), enhancing EUR/JPY’s appeal for yield-seeking investors.
Carry Trade Implications:
The positive rate differential supports bullish EUR/JPY momentum, as investors borrow low-yielding JPY to invest in higher-yielding EUR assets.
However, JPY strength has emerged recently due to BOJ hawkish expectation, Japan’s core inflation hit a >2-year high in May, fueling bets on future rate hikes.
Geopolitical easing: The Israel-Iran ceasefire reduced safe-haven JPY demand, partially offsetting carry trade pressure.
Technical Outlook for EUR/JPY
Bullish Bias: The pair awaits a breakout above 169.659 to target 170.00 bullish ascending trendline breakout
Key Risks:
Failure to breach 169.659 could trigger a correction toward 167 and below especially if BOJ maintains hawkish rhetoric's
A drop below 167.may activate bearish momentum, though the broader uptrend remains intact.
Technical Breakout: A close above 169.659 could accelerate gains toward 170.00.
Central Bank Divergence: The ECB-BOJ rate spread (+1.50%) and bond yield spread (+1.13%) underpin EUR strength, though JPY resilience from inflation/hawkish BOJ risks may cap upside.
Risk Sentiment: Further geopolitical calm could weaken JPY’s safe-haven role, amplifying carry trade inflows into EUR/JPY.
#eurjpy

EURJPY : m30 (Short Position)By analyzing the 30-minute time frame and observing liquidity at the lows, I have a bearish scenario from 169.10 down to 168.20

EURJPY SHORT FORECAST Q2 W26 D26 Y25EURJPY SHORT FORECAST Q2 W26 D26 Y25
Professional Risk Managers👋
Welcome back to another FRGNT chart update📈
Diving into some Forex setups using predominantly higher time frame order blocks alongside confirmation breaks of structure.
Let’s see what price action is telling us today! 👀
💡Here are some trade confluences📝
✅Weekly Order Block Identified
✅Daily Order block identified
✅4H Order Block identified
✅15' Order block identified
🔑 Remember, to participate in trading comes always with a degree of risk, therefore as professional risk managers it remains vital that we stick to our risk management plan as well as our trading strategies.
📈The rest, we leave to the balance of probabilities.
💡Fail to plan. Plan to fail.
🏆It has always been that simple.
❤️Good luck with your trading journey, I shall see you at the very top.
🎯Trade consistent, FRGNT X

EUR/JPY higherPrice retraced from Weekly FVG. The retracement had high momentum down, making Fair Value Gaps on the 4H. After 3 things aligned:
1. Price made new 4H Fair Value Gap coming from the Daily Fair Value Gap
2. Price disrespected Swing High in 4H Fair Value Gap
3. Rejection off D FVG closed with perfect 2 candle rejection.
I entered the trade after I've seen the close on the daily timeframe, Stop below the 4H Fair Value Gaps.

EURJPY Will Explode! BUY!
My dear friends,
My technical analysis for EURJPY is below:
The market is trading on 168.01 pivot level.
Bias - Bullish
Technical Indicators: Both Super Trend & Pivot HL indicate a highly probable Bullish continuation.
Target - 168.66
About Used Indicators:
A pivot point is a technical analysis indicator, or calculations, used to determine the overall trend of the market over different time frames.
Disclosure: I am part of Trade Nation's Influencer program and receive a monthly fee for using their TradingView charts in my analysis.
———————————
WISH YOU ALL LUCK
EURJPY- Sell Now Setup on 15 minute ChartEURJPY- Sell Now Setup on 15 minute Chart based on CRT method and Strategies based on TBS, M1 and LS at HTF. Accoridngly Targets are expeceted to be acheived with SL in place.

EURJPY: Bullish Trend Continues 🇪🇺🇯🇵
EURJPY shows a strength after a test of a significant demand zone.
Bullish breakout of a resistance line of a flag pattern provides
a strong trend-following signal.
Goal - 169.64
❤️Please, support my work with like, thank you!❤️
I am part of Trade Nation's Influencer program and receive a monthly fee for using their TradingView charts in my analysis.

EURJPY Potential Bearish BatOn the daily chart, EURJPY fluctuates upward, and short-term bulls have the upper hand. At present, attention can be paid to the resistance near 173.03 above, which is a potential short position of the bearish bat pattern, and this position is in the previous supply area.

EURJPY- buying SetupEURJPY- BuAiming for atleast 50% target to be acheived in buying position based on technical analysis and CRT Strategy. lets see how it goes :)

EURJPY: A Big Move In Making, Please Share Your Views! Date: 22/06/2025
Hello everyone,
I hope you’re all having a good weekend. As we previously discussed, we expected a sharp decline in Europe/JPY, but unfortunately, it didn’t work out in our favour due to the extremely bullish US dollar. This led to the crossing and invalidation of our two selling zones.
Looking at next week’s price projection, we can confirm that the price is heading towards 170.50 and may be selling at this level. Therefore, we will be keeping a stop loss at 171.50.
Once the trade is activated, we can set our target at 166.0, 163.50, and the final target will be placed at 158.50.
If you like our work, please like our idea.
Good luck and trade safely next week.

EURJPY Long Opportunity EURJPY currently has bullish market directionality and is on a retracement. price is trading above the 50 SMA and we can observe bullish momentum from the RSI trading above the 55 level.
Potentially break and retest zone at 167,550. Awaiting a reaction to this level which could see the bullish trend resuming.

EURJPY Setup Alert!
We’re waiting for the price to reach our marked level.
No emotional trades — let the setup come to you! ⏳
Levels are shown on the chart.
Follow us here: forexCSP

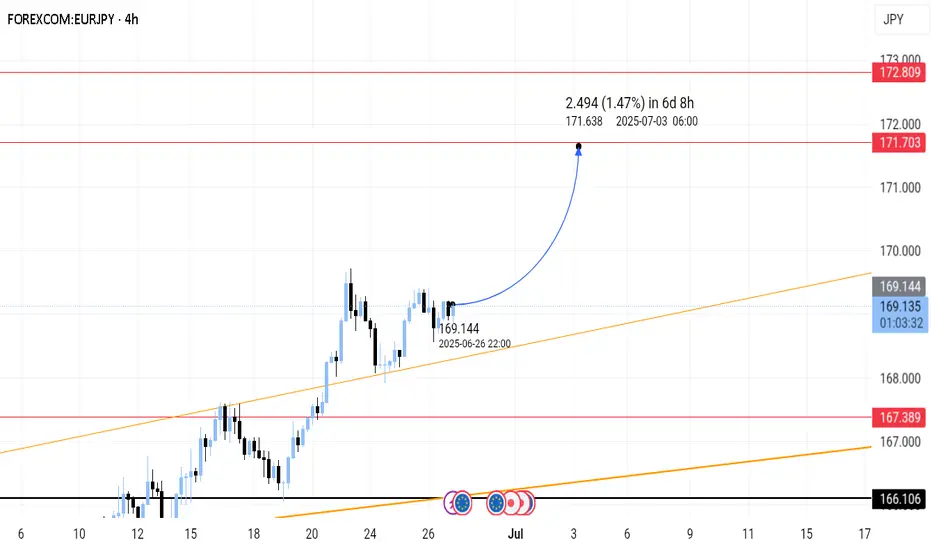
EURJPY – Buy the Dip in a Bullish TrendTrade Idea
Type: Buy Limit
Entry: 167.63
Target: 169.50
Stop Loss: 166.87
Duration: Intraday
Expires: 25/06/2025 06:00
Technical Overview
The broader trend in EURJPY remains bullish, and there's no clear indication the uptrend is ending.
While a short-term correction is possible, it is viewed as a healthy retracement within the trend.
A Buy Limit at 168.00, just above support, provides an efficient entry with a tight stop and strong upside potential.
A move above 169.00 would confirm renewed bullish momentum, aligning with the measured move target at 169.75.
With no major economic events in the next 24 hours, price action is expected to be technically driven.
Key Technical Levels
Support: 168.50 / 168.00 / 167.50
Resistance: 169.00 / 169.50 / 169.75
Disclosure: I am part of Trade Nation's Influencer program and receive a monthly fee for using their TradingView charts in my analysis.

EURJPY Sell- Go for sell
- Refine entry with smaller SL for better RR, if you know how
- keep looking for sell even if price goes one more up
A Message To Traders:
I’ll be sharing high-quality trade setups for a period time. No bullshit, no fluff, no complicated nonsense — just real, actionable forecast the algorithm is executing. If you’re struggling with trading and desperate for better results, follow my posts closely.
Check out my previously posted setups and forecasts — you’ll be amazed by the high accuracy of the results.
"I Found the Code. I Trust the Algo. Believe Me, That’s It."


EURJPY BUY SETUPThe zone has been depicted in the chart for buy entry.
we will wait for the market structure shift on LTF to enter .
Please follow to support me.
