EJ Sell- keep looking for sell if setup given
- ideally wait for price pull back to premium level
- sell only if entry setup given
- refine entry with smaller SL for better RR, if you know how
- manage your trade and aim 164 level or lower
JPYEUR trade ideas

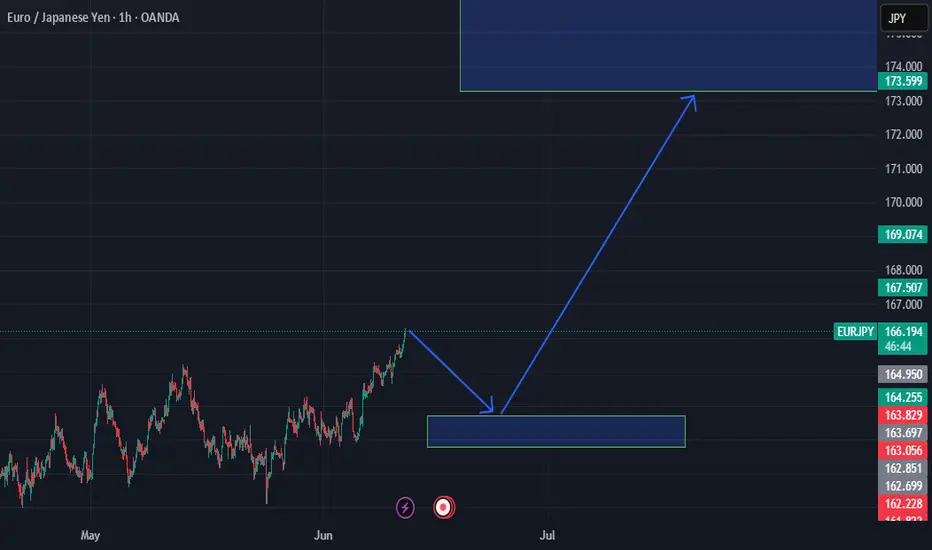
EURJPY Trade IdeaEURJPY is maintaining a strong bullish structure on the 1H chart, with price action consistently forming higher highs and higher lows.
My targets are set at the next resistance levels for partial and extended profits, with a final target at the upper resistance if bullish momentum persists.
Stop loss is placed just below the previous swing low.

EUR/JPY: Evening star warning as 165 holds by a threadEUR/JPY is on the cusp of confirming an evening star pattern, setting up a potential short if the price closes around current levels or lower.
165.00 remains key support. It’s already been tested today before bouncing—price behaviour we’ve seen before. It often trades through but rarely closes below with conviction, putting focus on how it trades into and out of the weekend, especially given EUR/JPY’s tendency to deliver reliable signals.
A break of Monday’s low at 164.60 would allow shorts to be initiated, with a stop above 165 for protection. Initial downside targets include the 50-day moving average, 163.00, or the 200-day moving average—depending on the risk-reward profile you're after.
Expect bids around 164, so be ready to square the trade if momentum stalls. If price rallies into the Friday close, the bearish setup would be invalidated.
Good luck!
DS

EURJPY sellIt seems that EURJPY is about to experience a significant downward movement, and a good opportunity for a sell position has emerged.

BUYCurrently Watching Price respecting BULLISH structure clean HH and HL pushing back above EMA a break and close above minor resistance could fuel momentum toward the HH target zone.

SHORT ON EUR/JPYOn the 1 min Timeframe EJ has given us a choc (change of character) to the downside with a nice break and retest to a major supply area.
The JPY index is bullish which should cause EJ to fall.
I will be selling EJ to the next level of demand looking to catch 100-200 pips.

Title: EURJPY – Buying the Next Higher-Low Toward 166.50-166.70Price has stair-stepped higher all week, printing a clean series of higher highs / higher lows.
We’ve just pulled back into the most recent swing-low zone (mini A-B-C correction).
As long as that structure holds above 165.20–165.30, I’m looking for the next leg to extend toward 166.50.
Idea is invalidated on a decisive close below the blue 200-EMA / prior higher-low zone.

EUR/JPY SHORT FROM RESISTANCE
Hello, Friends!
The BB upper band is nearby so EUR-JPY is in the overbought territory. Thus, despite the uptrend on the 1W timeframe I think that we will see a bearish reaction from the resistance line above and a move down towards the target at around 164.236.
Disclosure: I am part of Trade Nation's Influencer program and receive a monthly fee for using their TradingView charts in my analysis.
✅LIKE AND COMMENT MY IDEAS✅

EURJPY SELLEURJPY I have a bearish bias and am looking for a sell now as it has reached my resistance and created an evening star on the 4hour time frame
EUR-JPY Pullback Ahead! Sell!
Hello,Traders!
EUR-JPY keeps growing
Just as I predicted in my
Previous analysis and the
Pair is locally overbought
So after the pair hits the
Horizontal resistance above
At 166.715 we will be
Expecting a local pullback
And a bearish correction
Sell!
Comment and subscribe to help us grow!
Check out other forecasts below too!
Disclosure: I am part of Trade Nation's Influencer program and receive a monthly fee for using their TradingView charts in my analysis.

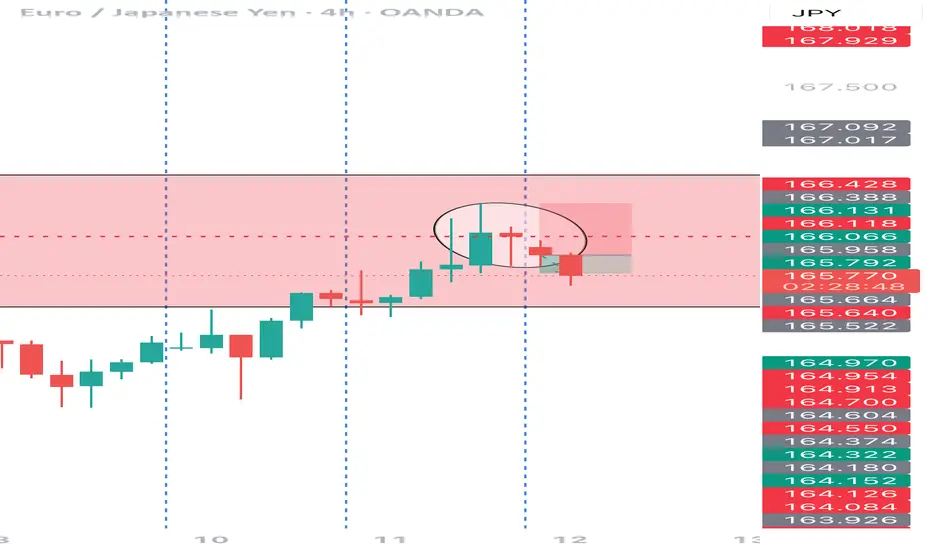
EURJPY - Already Over-Bought!Hello TradingView Family / Fellow Traders. This is Richard, also known as theSignalyst.
📈EURJPY has been overall bullish trading within the rising wedge pattern marked in blue. However, it is currently retesting the upper bound of the wedge.
Moreover, the green zone is a major weekly high.
🏹 Thus, the highlighted red circle is a strong area to look for sell setups as it is the intersection of the upper blue trendline and weekly high.
📚 As per my trading style:
As #EURJPY approaches the red circle zone, I will be looking for bearish reversal setups (like a double top pattern, trendline break , and so on...)
📚 Always follow your trading plan regarding entry, risk management, and trade management.
Good luck!
All Strategies Are Good; If Managed Properly!
~Rich
Disclosure: I am part of Trade Nation's Influencer program and receive a monthly fee for using their TradingView charts in my analysis.

EUR/JPY Short🎯 Trade Setup Plan
👇 Aggressive Entry (Riskier)
Sell Limit: 164.90
SL: 165.90
TP1: 160.00
TP2: 157.00
TP3 (optional): 155.00
Use this only if you want to catch the wick, but recognize the higher chance of being swept.
✅ Conservative Entry (Recommended)
Wait for a daily candle close under 162.00 after touching 164. That confirms rejection.
Entry: On next day’s minor retest (e.g., 162.50–163.00)
SL: 165.50 (above recent highs)
TP1: 160.00
TP2: 157.00
TP3: 155.00
Risk: 1–2% depending on confirmation strength
📌 Optional Breakout Plan (In case resistance breaks cleanly)
Buy Stop: 165.60
SL: 164.30
TP: 170.00 (weekly resistance)
Use only if a strong daily close above 165 confirms breakout.

eurusd analyse 1H*The content on this analysis is subject to change at any time without notice, and is provided for the sole purpose of assisting traders to make independent investment decisions.
EURJPY Wave Analysis – 11 June 2025- EURJPY broke the key resistance level 165.00
- Likely to rise to the resistance level 168.00
EURJPY currency pair recently broke the key resistance level 165.00 (which has been steadily reversing the pair from the start of November, as can be seen from the daily EURJPY chart below).
The breakout of the resistance level at 165.00 accelerated the active sub-impulse wave 3 of the higher-order impulse wave (C) from April.
EURJPY currency pair can be expected to rise to the next resistance level 166.50 (former multi-month high from November) – the breakout of which can lead to further gains toward 168.00.

Technical outlook for the EUR/JPYThe EUR/JPY pair is trading in a general uptrend, forming higher highs and higher lows, which maintains a bullish momentum.
What’s the pair’s next expected move?
As long as the 164.556 level is not broken with a 4-hour candle closing below it, any pullback remains corrective. The pair is likely to rebound from the 164.823 level to target the 165.510 level.

EURJPY-sell strategy Line brk (2) 6-hourlyThe pair is slightly moving higher and so far it is still positive. the pair is slightly overbought, and suspect we may see lower levels incoming sessions.
Strategy SELL. @ 165.50-165.85 and take profit near 164.37 for now.

EUR_JPY RESISTANCE AHEAD|SHORT|
✅EUR_JPY is going up to retest
A horizontal resistance of 166.656
Which makes me locally bearish biased
And I think that we will see a pullback
And a move down from the level
Towards the target below at 165.000
SHORT🔥
✅Like and subscribe to never miss a new idea!✅
Disclosure: I am part of Trade Nation's Influencer program and receive a monthly fee for using their TradingView charts in my analysis.

EURJPY ANALYSISAfter seeing the previous daily candle close really bullish above 165.000 key weekly are, we could expect the bullish momentum to continue with confirmations on the 4hr structure making HH and HL


EUR-JPY Bullish Breakout! Buy!
Hello,Traders!
EUR-JPY is trading in an
Uptrend an the pair made a
Bullish breakout of the key
Horizontal level of 165.000
Which is confirmed so after
A a potential pullback we will
Be expecting a further
Bullish continuation
Buy!
Comment and subscribe to help us grow!
Check out other forecasts below too!
Disclosure: I am part of Trade Nation's Influencer program and receive a monthly fee for using their TradingView charts in my analysis.

EURJPY HTF Distribution pt.2This is the lower timeframe distribution model I mentioned in pt.1. I am looking either for a model 2 from extreme supply or another deviation inside the deviation limit for a model 1. A good time displacement would be optimal and a bearish BOS would confirm it for a valid entry.

EURJPY HTF Distribution pt.1This could end up as a model 1 distribution that gets completed with another distribution model as 2nd deviation while coming into supply. With the right confirmations this could end up in a beautiful trade. I will make a part 2 in a minute where i show the potential lower time frame distribution model.

CHECK EURJPY SIGNAL READ CAPTAIN(EURJPY) trading signals technical analysis satup👇🏼
( EURJPY) BUY zone
( TRADE SATUP)
ENTRY POINT (165.200 to (165.150) 📊
FIRST TP (165.400)📊
2ND TARGET (165.600) 📊
LAST TARGET (165.800) 📊
STOP LOOS (164.950)❌
Tachincal analysis satup
Fallow risk management
