eurusd analyse 1H*The content on this analysis is subject to change at any time without notice, and is provided for the sole purpose of assisting traders to make independent investment decisions.
JPYEUR trade ideas
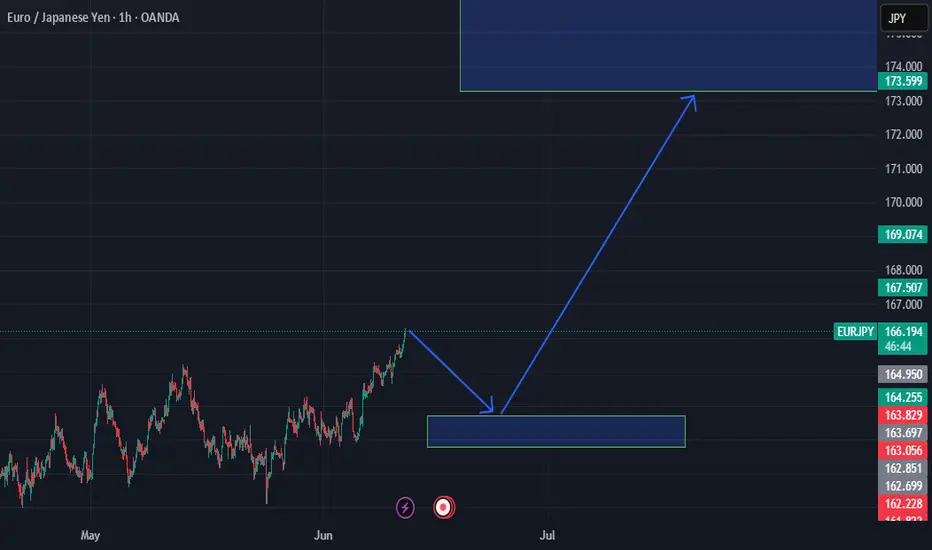
EURJPY Wave Analysis – 11 June 2025- EURJPY broke the key resistance level 165.00
- Likely to rise to the resistance level 168.00
EURJPY currency pair recently broke the key resistance level 165.00 (which has been steadily reversing the pair from the start of November, as can be seen from the daily EURJPY chart below).
The breakout of the resistance level at 165.00 accelerated the active sub-impulse wave 3 of the higher-order impulse wave (C) from April.
EURJPY currency pair can be expected to rise to the next resistance level 166.50 (former multi-month high from November) – the breakout of which can lead to further gains toward 168.00.

Technical outlook for the EUR/JPYThe EUR/JPY pair is trading in a general uptrend, forming higher highs and higher lows, which maintains a bullish momentum.
What’s the pair’s next expected move?
As long as the 164.556 level is not broken with a 4-hour candle closing below it, any pullback remains corrective. The pair is likely to rebound from the 164.823 level to target the 165.510 level.

EURJPY-sell strategy Line brk (2) 6-hourlyThe pair is slightly moving higher and so far it is still positive. the pair is slightly overbought, and suspect we may see lower levels incoming sessions.
Strategy SELL. @ 165.50-165.85 and take profit near 164.37 for now.

EUR_JPY RESISTANCE AHEAD|SHORT|
✅EUR_JPY is going up to retest
A horizontal resistance of 166.656
Which makes me locally bearish biased
And I think that we will see a pullback
And a move down from the level
Towards the target below at 165.000
SHORT🔥
✅Like and subscribe to never miss a new idea!✅
Disclosure: I am part of Trade Nation's Influencer program and receive a monthly fee for using their TradingView charts in my analysis.

EURJPY ANALYSISAfter seeing the previous daily candle close really bullish above 165.000 key weekly are, we could expect the bullish momentum to continue with confirmations on the 4hr structure making HH and HL


EUR-JPY Bullish Breakout! Buy!
Hello,Traders!
EUR-JPY is trading in an
Uptrend an the pair made a
Bullish breakout of the key
Horizontal level of 165.000
Which is confirmed so after
A a potential pullback we will
Be expecting a further
Bullish continuation
Buy!
Comment and subscribe to help us grow!
Check out other forecasts below too!
Disclosure: I am part of Trade Nation's Influencer program and receive a monthly fee for using their TradingView charts in my analysis.

EURJPY HTF Distribution pt.2This is the lower timeframe distribution model I mentioned in pt.1. I am looking either for a model 2 from extreme supply or another deviation inside the deviation limit for a model 1. A good time displacement would be optimal and a bearish BOS would confirm it for a valid entry.

EURJPY HTF Distribution pt.1This could end up as a model 1 distribution that gets completed with another distribution model as 2nd deviation while coming into supply. With the right confirmations this could end up in a beautiful trade. I will make a part 2 in a minute where i show the potential lower time frame distribution model.

CHECK EURJPY SIGNAL READ CAPTAIN(EURJPY) trading signals technical analysis satup👇🏼
( EURJPY) BUY zone
( TRADE SATUP)
ENTRY POINT (165.200 to (165.150) 📊
FIRST TP (165.400)📊
2ND TARGET (165.600) 📊
LAST TARGET (165.800) 📊
STOP LOOS (164.950)❌
Tachincal analysis satup
Fallow risk management

EURJPY SHORT FORECAST Q2 W24 D10 Y25EURJPY SHORT FORECAST Q2 W24 D10 Y25
Professional Risk Managers👋
Welcome back to another FRGNT chart update📈
Diving into some Forex setups using predominantly higher time frame order blocks alongside confirmation breaks of structure.
Let’s see what price action is telling us today! 👀
💡Here are some trade confluences📝
✅Weekly 50 EMA target
✅15' Order block identification
✅Daily Order block rejection
✅Ultimate high short
🔑 Remember, to participate in trading comes always with a degree of risk, therefore as professional risk managers it remains vital that we stick to our risk management plan as well as our trading strategies.
📈The rest, we leave to the balance of probabilities.
💡Fail to plan. Plan to fail.
🏆It has always been that simple.
❤️Good luck with your trading journey, I shall see you at the very top.
🎯Trade consistent, FRGNT X

CHECK EURJPY SIGNAL READ CAPTAIN(eurjpy) buy zone
( trade satup )
entry point (164.870) to (165.030) 📊
first tp (165.250)📊
2nd target (165.675) 📊
last target (166.185) 📊
stop loss (164.480)❌

EURJPY Technical Breakdown (MMC Strategy) : Target Zone 🧠 Concept Focus: MMC – Mirror Market Concept
The Mirror Market Concept (MMC) helps identify pattern inversions, price reflection zones, and structural symmetry that hint at upcoming market turns. This chart reflects a curve-based reversal logic rooted in smart money behavior, volume analysis, and pattern exhaustion.
📊 Technical Structure Breakdown
🔹 1. Volume Contraction + Breakout (June 6–7)
Early signs of bullish pressure were detected with volume contraction, forming a tight range wedge/triangle.
This is often a liquidity trap where weak hands sell into strength.
Smart money absorbed sell-side liquidity before impulsively breaking out.
This is a common MMC move: contract > trap > expand.
🔹 2. 50% Area Used – Smart Money Trap (June 9)
After the breakout, price tapped into the 50% equilibrium zone of the previous major move.
This level often acts as a liquidity sweep zone, ideal for smart money to unload or build counter positions.
The rejection wick here confirms that institutional traders reacted at this level.
🔹 3. Curve Bending Pattern – Exhaustion in Play
The market has now entered a curve bending phase, visible with the arching price movement.
This signifies momentum exhaustion, where bullish attempts get weaker.
Think of this curve like a mirror ceiling — as each high gets tapped, it bends, showing the market can't sustain higher levels.
🔹 4. Next Reversal Zone (Projected Target: ~164.150–164.200)
Based on MMC symmetry and previous demand zones, the area highlighted as Next Reversal is a key structure zone.
This is where we expect price to react — either bounce (for buyers) or break (for continuation shorts).
A clean bounce here could mirror the earlier pattern in reverse, hence the Mirror Market Concept.
🔁 Summary of Market Psychology
🧲 Volume contraction signals manipulation.
🎯 50% zone rejection shows trap completion.
🪞 Curve bending shows buyers losing strength.
🔻 Price likely to drop into the reversal zone, completing the mirror leg.
🧩 What Traders Should Watch
Indicator/Zone Notes
50% Area Used Smart Money Exit or Entry Trap
Curve Bending Reversal Geometry (Momentum Exhaustion)
Next Reversal Zone Smart Money Demand Zone (~164.150)
Break Below 164.100 Confirms deeper bearish continuation
🎯 Trading Strategy Outlook
🔍 Short Bias: Look for confirmation (e.g., bearish engulfing, BOS on lower TFs) to enter shorts below curve zone.
🛑 Invalidation Level: Clean breakout above 165.500 would invalidate the mirror structure and shift to continuation long.
🎣 Reversal Scouting : If price respects the Next Reversal Zone, there could be a potential long scalp back into mid-range.
🧠 Educational Note: MMC in Action
The Mirror Market Concept is powerful for intraday trading. It uses pattern reflection, liquidity logic, and price symmetry to forecast reversals before typical indicators catch up. If mastered, this concept can give early reversal entries and trap avoidance.

Strong sell eurjpyStrong sell pressure can come
Weekly and daily overbought pair
Daily trend broken and retested

EUR/JPY – The Crash Is Loading...Retail just got wiped out again.
Look at this chart — liquidity was taken above the previous highs, exactly where retail traders expected a breakout.
But here’s the truth:
This was never a breakout — it was smart money manipulation.
The market created fake momentum to trap buyers, then swept their stop losses and filled institutional sell orders at premium pricing.
Now the path is set:
Liquidity is taken ✅
No strong continuation after breakout ❌
Perfect rejection candle forming 🧠
Price is likely to retrace all the way to the 162.00 demand zone and even deeper
⚔️ Why You Need to Act Now:
This is a textbook high risk-reward opportunity:
Entry after liquidity sweep
SL tight above the wick
Massive downside room
Smart money already positioned — you should be too
💡 Remember: The market doesn’t move by luck — it moves by manipulation.
Those who understand that… capitalize on it.

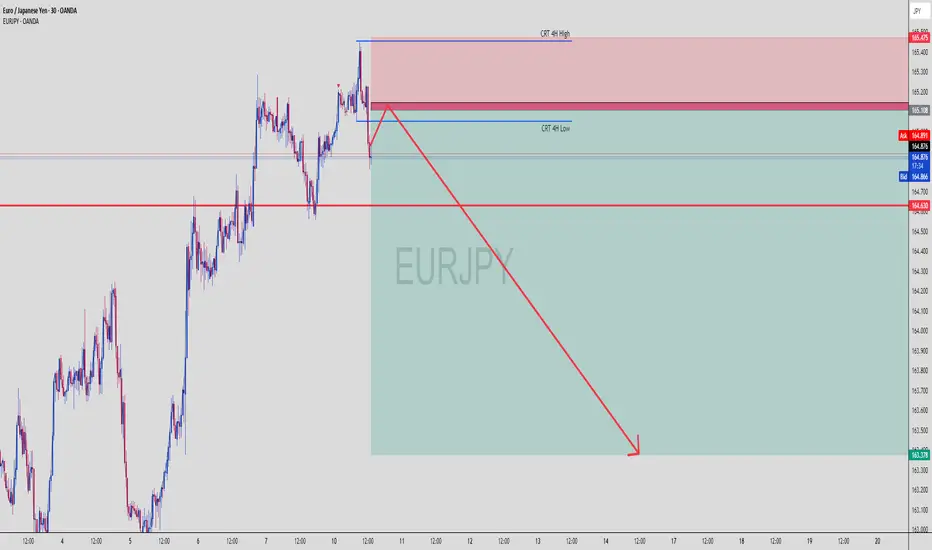
EURJPY Tapped 4H Supply – Massive Drop Loading?EURJPY | 30-Min View with 4H CRT Zones
🔥 This is where Smart Money sharpens their blades…
🧊 New Confluence Just Dropped:
🔴 CRT 4H High Zone: 165.108–165.475
Price wicked right into the 4H Compression Reversal Top (CRT) — ideal Smart Money trap zone
This area aligns perfectly with the bearish OB/supply from previous screenshot
🔵 CRT 4H Low Zone: Around 164.630
Strong structure level where liquidity is sitting
Price respected it as temporary support before likely break-and-retest continuation
🔍 Price Action Logic:
✅ Price faked out above CRT 4H High, grabbing liquidity
✅ Immediate rejection candle with wick rejection signals institutional selling
🔁 Now price is retesting the mid-OB / lower CRT, likely forming a breaker pattern
🟥 Huge clean imbalance to the downside — marked by that juicy green TP box
🔽 Expectation: price fills inefficiency and heads to 163.378 minimum
🎯 Trade Parameters:
🔻 Entry Zone 165.100 – 165.397 (Red Supply / CRT High)
🛡 SL Above 165.475 (CRT 4H High)
🎯 TP Target 163.378 (bottom imbalance fill)
⚖️ RRR Over 1:4 potential — high precision entry zone
🧠 Chart Ninja Analysis:
“When CRT zones align with OBs and liquidity sweeps,
that’s a Smart Money feast waiting to happen.” – 🥷
This chart is a classic reversal blueprint. If you missed the first tap — wait for the retest. If this holds below CRT Low (164.630), expect full bearish momentum into midweek.
📊 Confirmation Tactics:
🔄 M15 bearish engulfing / shift in structure after tap into CRT
🔻 Break of 164.630 = confirmation of bearish intent
⏳ Optional: use FVG + volume spike as further entry triggers
🚨 Save this chart — it's one of those sniper moments where everything aligns!
EURJPY Bulls in Trouble? Massive Rejection Signals📉 Full Multi-Factor Analysis – EUR/JPY
🔍 1. Price Action
EUR/JPY strongly rejected the key supply zone between 164.80–165.50, aligned with a major static resistance.
Last week's breakout was invalidated by a clear bull trap, followed by a bearish engulfing candle.
Price broke below the ascending channel drawn since April and is now heading toward the 162.00 demand area.
The weekly RSI shows a bearish divergence, confirming a slowdown in momentum.
➡️ Technical Bias: Bearish toward 161.50–162.00, with a possible extension to 160.00.
💼 2. COT Data – Commitment of Traders
EUR Futures (CME)
Strong increase in commercial longs (+16,095) and non-commercial shorts (+4,830).
Suggests smart money is accumulating while retail/speculators are pressing shorts — potential accumulation, but no breakout yet.
JPY Futures
Significant rise in non-commercial shorts (+10,575), while long positions declined.
The yen remains pressured, but extreme positioning could fuel a reversal if sentiment flips.
➡️ COT Takeaway: Euro remains in bullish consolidation. Yen is heavily oversold — ripe for mean reversion. Caution warranted.
📊 3. Retail Sentiment
80% of retail traders are short from an average price of 160.46, while price now sits at 164.86.
The crowd is deep in drawdown — a typical condition for short-term consolidations or fakeouts before reversals.
➡️ Implication: Price may hover around 164+ to trap remaining retail shorts before unwinding.
📈 4. Seasonality
June seasonality for EUR/JPY is historically neutral to bearish.
Only the 5-year data shows strength, while 15Y and 20Y trends reveal consistent downside starting mid-June.
➡️ Seasonal Outlook: Adds further weight to a bearish correction scenario for the second half of the month.
✅ Actionable Summary
📌 Weekly Bias: Bearish
📉 Main Target: 162.00–161.50
📉 Extended Target: 160.00
📈 Invalidation: Weekly close above 165.60
🧠 Final Thoughts
All major elements — price action, COT, sentiment, and seasonality — point toward a corrective move on EUR/JPY.
Given the strong underlying trend and retail’s positioning, watch out for bull traps before deeper downside.
Best setup: Sell the pullback or wait for clean breakdown below 163.00.

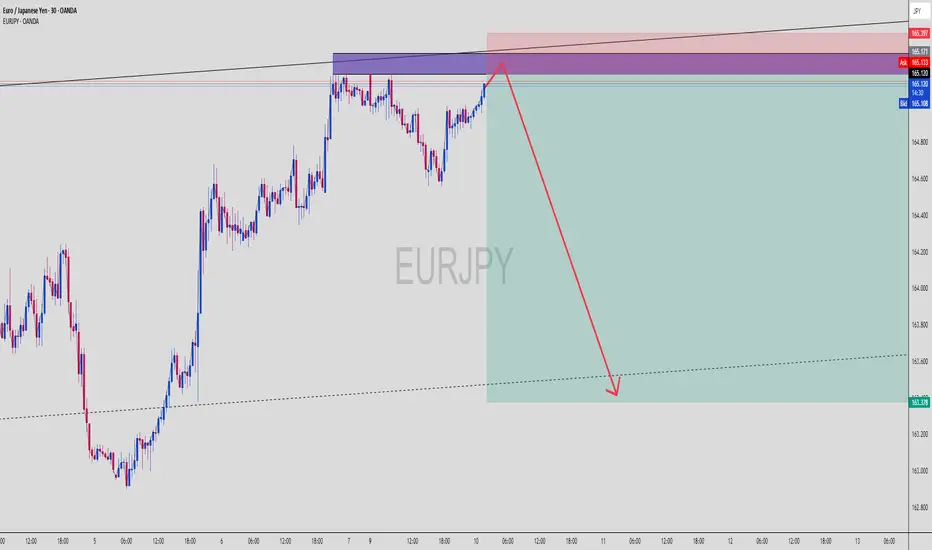
EURJPY Supply Tap! Bearish Reaction Coming?EURJPY (30-Min) | Supply Zone Hit + Bearish Reversal Setup
This EURJPY move is brewing into a classic SMC bearish play — engineered liquidity run, supply zone reaction, and a projected melt to imbalance below. Let’s dissect the ninja logic 🧠📉
🔍 Breakdown of the Setup:
🟥 Supply / Order Block Zone
Price enters a strong bearish OB zone between 165.100–165.397
Previous rejection wicks in this zone = smart money sell interest
Price now testing that area again — potential for liquidity sweep + reversal
🟪 Multi-Zone Confluence
Multiple overlapping zones stacked: OB, mitigation block, and liquidity sweep area
Perfect spot for Smart Money to unload positions before sending price lower
📏 Risk-Reward Optimization
Entry near 165.100–165.397 zone
Stop Loss placed slightly above the last rejection wick (above 165.397)
Take Profit projected around 163.378 based on measured impulse leg and imbalance fill
🧠 Liquidity Narrative
The rally into supply is likely a buy-side liquidity hunt
Smart Money often drives price into key zones before triggering reversals
Price may wick above 165.171 to fake bulls before a strong sell-off
🧠 Chart Ninja Entry Plan:
🔻 Entry Zone 165.100 – 165.397 (Supply OB)
🛡 SL Above 165.450 (above wick / last structure high)
🎯 TP Target 163.378 (imbalanced fill target)
⚖️ RRR Approx. 1:4+ depending on entry precision
🥷 Chart Ninja Note:
“The trap is always set where the crowd feels the safest —
and that’s exactly where the ninja strikes.” 🥷📉
This setup could be a clean ride down if price reacts as expected. Confirmation entry = bearish engulfing on M15 or M30.
🔁 Bonus Observation:
You can see lower timeframes building internal liquidity, meaning we might get a sharp, volatile drop once that top wick finishes sweeping.
📍Mark this zone and set an alert — entry can trigger fast!
🔥 What’s your confirmation style — engulfing candle or breaker structure?
EURJPY Short Opportunity - Price at Resistance LevelAs seen from the chart above, the price of EURJPY has hit a major resistance level. Even though the trend is indicating that it is going upwards, this is a very good short opportunity in the short term.

order for eurjpy*The content on this analysis is subject to change at any time without notice, and is provided for the sole purpose of assisting traders to make independent investment decisions.

Technical Analysis: JPY Price Action Near Resistance – Potential📊 Technical Analysis: JPY Price Action Near Resistance – Potential Reversal Ahead? ⚠️
---
🔍 Overview:
This chart illustrates the recent price action of a JPY-based asset (likely a JPY forex pair), currently testing a major resistance zone around the 165.286–165.500 area. The market is reacting sharply at this level, suggesting a possible rejection and correction downward. The setup is marked with well-defined support/resistance levels and potential retracement targets.
---
🟧 Key Zones:
🛑 Resistance Zone (165.286 – 165.500): Price is currently reacting at this overhead supply zone. This level has historically rejected bullish attempts, as seen in previous price action.
🟩 Support Zone (161.302 – 161.550): This demand zone has served as a strong base previously and is marked as the final potential retracement level (labeled "4") in the chart.
---
🔻 Retracement Levels:
Labeled as 1 through 4 in purple lines:
1. Level 1 – 163.948 🟣: Initial minor support; might provide a short-term pause if price pulls back.
2. Level 2 – 162.803 🔄: Mid-level support; watch for consolidation or bounce.
3. Level 3 – 162.091 🧲: Stronger support and possible bounce level.
4. Level 4 – 161.550 🛡️: Key support aligning with historical demand zone. A break below this could signal trend reversal.
---
🔄 Price Projection:
The curved arrow indicates a potential correction from the resistance zone down toward the support levels, especially targeting Zone 4. This move reflects a typical market reaction when price meets strong resistance after a steep rally.
---
📈 Strategic Implications:
For Bulls 🐂: Wait for confirmation of support at any of the retracement levels (especially 3 or 4) before entering.
For Bears 🐻: This is an optimal area to look for short entries, especially if bearish candlestick patterns confirm rejection from the resistance zone.
---
✅ Conclusion:
Price is at a critical decision point near major resistance. A bearish reversal is likely if the resistance holds, with a corrective move toward 161.302–161.550 being the most probable target range. Traders should watch for confirmation signals before committing to positions.
---
📌 Tip: Keep an eye on candlestick patterns and volume at the resistance zone to validate the reversal hypothesis.
