EURJPY - Wave 5 Final Push? Time to Watch for Reversal🌀 EURJPY - Wave 5 Final Push? Time to Watch for Reversal 🚨 (Elliott Wave + AO Divergence + Fib Confluence)
📆 Date: May 19, 2025
📊 Pair: EUR/JPY
⏱️ Timeframe: 1H
🔍 Tools: Elliott Wave, Fibonacci Extension, Awesome Oscillator (AO)
🧠 Technical Breakdown
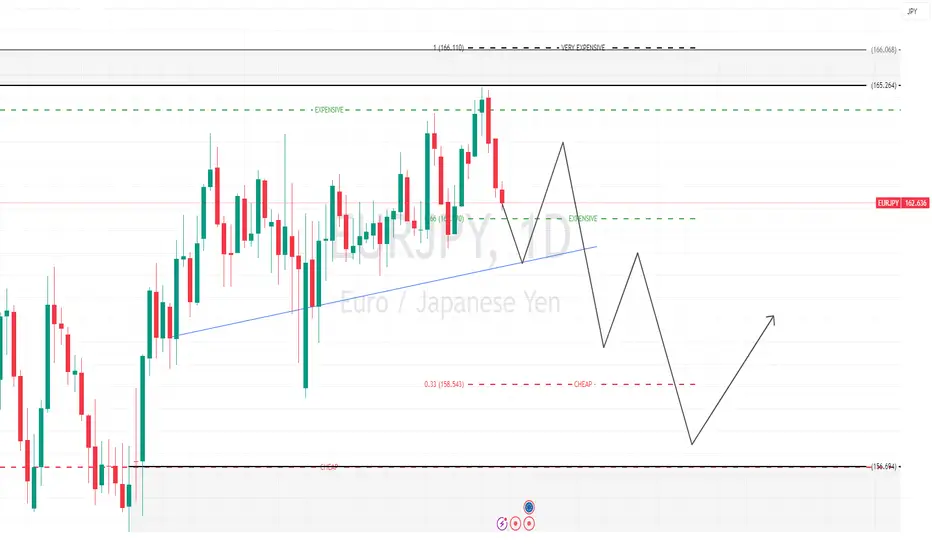
We are currently tracking a textbook Elliott Wave impulsive decline, with price forming a clean 5-wave structure to the downside. The pair now seems to be completing Wave (5) — and several strong signals suggest that a bullish reversal might be imminent.
🔢 Elliott Wave Count
✅ Wave (1) to (4) are already completed.
🔻 Wave (5) has broken below the 2.618 fib extension — which confirms an extended fifth wave.
📉 Current downside target zone lies between the 4.236 – 4.786 extensions:
4.236: ~161.796
4.786: ~161.275
This blue box zone (161.80 – 161.27) is now a high-probability completion area for Wave (5).
📈 Awesome Oscillator (AO) – Bullish Divergence Detected
AO shows a clear bullish divergence between Waves (3) and (5).
Momentum is fading on the bearish side while price makes a new low — classic signal of potential trend reversal.
🎯 Trade Plan: Wait for Confirmation
We’re not jumping in yet — but we’re close.
✅ What to Watch For:
Let price reach the 4.236–4.786 fib zone (at minimum 161.796).
Wait for a Break of Structure (BoS) — a clear break above a recent lower high (likely Wave 4).
On the retest or pullback, look for long entry setups such as:
Bullish engulfing candles
Pin bar rejection
MACD/AO flip
Trendline breakout retest
🎯 Targets
TP1: 162.80 – 163.50 (previous Wave 4 zone)
TP2: 50% – 61.8% retracement of Wave (5)
TP3: 164.40 – 165.20 (supply zone and structure confluence)
🛑 Stop Loss Idea
Place SL below the 4.786 extension (~161.27) or beneath the new low formed, depending on your entry type (aggressive vs conservative).
⚡ Summary
This setup brings multiple confluences together:
✅ Elliott Wave (5-wave completion)
✅ Fibonacci extension target zone
✅ AO bullish divergence
✅ Waiting for structure break for smart entry
💬 Let’s Talk
Are you watching this setup too? Drop a 👍 or your analysis below — let’s grow together!
✅ Follow me for more clean setups using Elliott Wave, Divergence, and Price Action.
🔔 Hit the alert — EURJPY is cooking something!
#EURJPY #ElliottWave #Forex #AO #BullishDivergence #FibExtension #PriceAction #WaveAnalysis #TradingSetup #ForexSignals
JPYEUR trade ideas

EURJPY-SELL strategy 9 hourly chart The pair is overall under pressure, but slightly oversold short term. I think we may see 160.00s in the medium term, and feel we should be in SELL mode, and trying to pick the right levels.
Strategy SELL @ 162.75-163.00 and take profit near 160.17 for now.

EURJPYEURJPY,as Sydney session opens we have seen a quick demand in EUR.i will watch for a much deeper pull back in demand zone later today in london and newyork session .

Bullish Idea!Based on Elliott Wave Pattern, EURJPY trend is surfing on Wave 3!
Buy Stop 164.600
SL: 164.100
T/P#1: 165.51 T/P#2: 166.49
Risk/Reward > 1.8

EURJPY Sell Setup- Wait for pullback then go for sell
- Refine entry with smaller SL for better RR, if your strategy allow
"I Found the Code. I Trust the Algo. Believe Me, That’s It."

EURJPY- SHORTI can see that with the expectations of the upcoming CPI due on Monday.
1. Prices moved back into our NO TRADE ZONE (FAIR VALUE) after touching our Key retail area.
2. The initial direction is showing a downtrend.
personally feel the rally has been exhausted and is ready for cooling of the Euro/Jpy
MY EXPECTATIONS:
- Deflationary Data outcome for the CPI
- Weaker Euro
- Bad news for the Euro
TO PUSH DOWN PRICES FURTHER into my wholesaler area
EURJPY: Will Keep Growing! Here is Why:
The analysis of the EURJPY chart clearly shows us that the pair is finally about to go up due to the rising pressure from the buyers.
Disclosure: I am part of Trade Nation's Influencer program and receive a monthly fee for using their TradingView charts in my analysis.
❤️ Please, support our work with like & comment! ❤️


EURJPY PlanWould have been a great trade if you caught this move last week,eurjpy has been moving beautifully and has given plenty of great trade oppurtunities.This week im looking for a reversal to print on monday for a early week trade opportunity to play out.Lets hope the pair continues to trade well

EURJPY (BOS + 0.5 DEMAND + 0.5 FIB + IMB)Hello Traders!
Here we have BOS on 1H TF, and the reason of pullback is to mitigate our 0.5 fib level + 0.5 DEMAND and fully close imbalance, after i will wait for confirmation on LTF.
Have a profitable day and don't forget to subscribe for updates!

EUR_JPY LOCAL LONG|
✅EUR_JPY is trading in an uptrend
With the pair set to retest
The rising support line
From where I think the growth will continue
LONG🚀
✅Like and subscribe to never miss a new idea!✅
Disclosure: I am part of Trade Nation's Influencer program and receive a monthly fee for using their TradingView charts in my analysis.

EURJPY Analysis: Range Bounces & BreakoutHello traders!
EURJPY is in a daily range and is offering three trading scenarios.
The first scenario suggests the pair may react bearishly from the currently approached zone, setting up a bounce opportunity that could drive price lower toward the 162.130 area.
The second scenario anticipates a bounce toward the 158.400 area, if price reaches the support zone of the range.
The third scenario anticipates a breakout above the resistance zone, followed by a retest, which could present a strong opportunity for continuation toward the 169.300 area.
Discretionary Trading: Where Experience Becomes the Edge
Discretionary trading is all about making decisions based on what you see, what you feel, and what you've learned through experience. Unlike systematic strategies that rely on fixed rules or algorithms, discretionary traders use their judgment to read the market in real time. It's a skill that can't be rushed, because it's built on screen time, pattern recognition, and the ability to stay calm under pressure.
There's no shortcut here. You need to see enough market conditions, wins, and losses to build that intuition—the kind that tells you when to pull the trigger or sit on your hands. Charts might look the same, but context changes everything, and that's something only experience can teach you.
At the end of the day, discretionary trading is an art, refined over time, sharpened through mistakes, and driven by instinct. It's not for everyone, but for those who've put in the work, it can be a powerful way to trade.

EURJPYnterest Rate Differential
European Central Bank (ECB):
Deposit rate: 2.25% (cut by 25 bps in April 2025).
Outlook: Markets expect two more cuts in 2025, potentially lowering rates to 1.75% by year-end, as tariff risks and weak growth persist.
Bank of Japan (BoJ):
Policy rate: 0.50% (held steady in May).
Outlook: BoJ lowered its 2025 GDP growth forecast to 0.5% (from 1.0%) due to U.S. tariff risks and weak Q1 data. Rate hikes are unlikely until 2026.
Differential: ~1.75% in favor of EUR, though ECB easing may narrow this gap.
Key Economic Data for May 2025
Eurozone
Q1 GDP Growth (Final):
0.3% QoQ (vs. preliminary 0.4%), marking the fifth straight quarter of growth.
Germany (+0.2%), Spain (+0.6%), and Italy (+0.3%) outperformed France (+0.1%).
Risks: U.S. tariffs on EU exports (potentially 20% starting July) threaten future growth.
ECB Policy Signals:
ECB President Lagarde emphasized a data-dependent approach, with further cuts likely if inflation remains subdued.
Japan
Q1 GDP Contraction:
-0.7% annualized (vs. -0.2% expected), driven by weak exports (-5.0%) and stagnant consumption.
U.S. tariffs on Japanese autos (24%) and machinery exacerbate recession risks.
BoJ Caution:
Governor Ueda warned of "downside risks" from trade tensions, signaling no near-term rate hikes despite inflation above target.
Directional Bias for EUR/JPY
Short-Term (May–June 2025): Bullish EUR/JPY
ECB’s higher rates (vs. BoJ’s 0.50%) sustain the euro’s yield advantage.
Japan’s weak GDP and tariff vulnerabilities keep JPY under pressure.
Medium-Term (H2 2025): Neutral-to-Bearish
ECB rate cuts (to 1.75%) could narrow the rate differential, reducing EUR appeal.
Safe-haven JPY demand may rise if U.S.-EU/Japan tariff tensions escalate.
#SHAVYFXHUB #EURJPY #JAPAN #EUROPE #EURO #yen #fx #forex

EURJPYInterest Rate Differential
European Central Bank (ECB):
Deposit rate: 2.25% (cut by 25 bps in April 2025).
Outlook: Markets expect two more cuts in 2025, potentially lowering rates to 1.75% by year-end, as tariff risks and weak growth persist.
Bank of Japan (BoJ):
Policy rate: 0.50% (held steady in May).
Outlook: BoJ lowered its 2025 GDP growth forecast to 0.5% (from 1.0%) due to U.S. tariff risks and weak Q1 data. Rate hikes are unlikely until 2026.
Differential: ~1.75% in favor of EUR, though ECB easing may narrow this gap.
Key Economic Data for May 2025
Eurozone
Q1 GDP Growth (Final):
0.3% QoQ (vs. preliminary 0.4%), marking the fifth straight quarter of growth.
Germany (+0.2%), Spain (+0.6%), and Italy (+0.3%) outperformed France (+0.1%).
Risks: U.S. tariffs on EU exports (potentially 20% starting July) threaten future growth.
ECB Policy Signals:
ECB President Lagarde emphasized a data-dependent approach, with further cuts likely if inflation remains subdued.
Japan
Q1 GDP Contraction:
-0.7% annualized (vs. -0.2% expected), driven by weak exports (-5.0%) and stagnant consumption.
U.S. tariffs on Japanese autos (24%) and machinery exacerbate recession risks.
BoJ Caution:
Governor Ueda warned of "downside risks" from trade tensions, signaling no near-term rate hikes despite inflation above target.
Directional Bias for EUR/JPY
Short-Term (May–June 2025): Bullish EUR/JPY
ECB’s higher rates (vs. BoJ’s 0.50%) sustain the euro’s yield advantage.
Japan’s weak GDP and tariff vulnerabilities keep JPY under pressure.
Medium-Term (H2 2025): Neutral-to-Bearish
ECB rate cuts (to 1.75%) could narrow the rate differential, reducing EUR appeal.
Safe-haven JPY demand may rise if U.S.-EU/Japan tariff tensions escalate.
#SHAVYFXHUB #EURJPY #JAPAN #EUROPE #EURO #yen #fx #forex

EURJPY ABC BULLISH PATTERNEURJPY Market momentum is going to make a ABC Bullish pattern with the specific target and against the target 🎯
Target 🎯 166.000
Stop loss. 161.500
Conclusion: It's a strong bullish pattern market analysis use this for making money and use proper strategies.

EURJPY is moving in a rising channelEURJPY is moving in a rising channel, and is just supported at channel edge, wait for a pullback, and we can have 10x bullish ride.

EUR-JPY Risky Long! Buy!
Hello,Traders!
EUR-JPY is trading along the
Rising support line and the
Pair will soon retest the
Support from where we will
Be expecting a bullish rebound
And a local move up
Buy!
Comment and subscribe to help us grow!
Check out other forecasts below too!
Disclosure: I am part of Trade Nation's Influencer program and receive a monthly fee for using their TradingView charts in my analysis.

EURJPY - Analysis and Potential Setups (Intraday- 16.05.2025)Brief Description:
A BoS as shown would give us additional confluence on this trade.
I will be taking an aggressive entry @ half risk and will add another position if we see price develop further and give us confirmation structures.

EURJPY Will Explode! BUY!
My dear friends,
EURJPY looks like it will make a good move, and here are the details:
The market is trading on 162.89 pivot level.
Bias - Bullish
Technical Indicators: Supper Trend generates a clear long signal while Pivot Point HL is currently determining the overall Bullish trend of the market.
Goal - 163.75
Recommended Stop Loss - 162.45
About Used Indicators:
Pivot points are a great way to identify areas of support and resistance, but they work best when combined with other kinds of technical analysis
Disclosure: I am part of Trade Nation's Influencer program and receive a monthly fee for using their TradingView charts in my analysis.
———————————
WISH YOU ALL LUCK

EUR/JPY forecast 🚨 **EUR/JPY Trade Setup**
📅 *Date:* April 24, 2025
💰 *Pair:* EUR/JPY
📊 *Timeframe:* M3/ M5
**Current Price:** 162.778
📍 **Sell Limit:** 162.917
🛑 **Stop Loss:** 162.969
🎯 **Setup Status:** Pending Execution
We’re waiting for **EUR/JPY** to pull back into the **162.917** supply zone to activate our **sell limit**. Stop loss is tight at 162.969, maintaining minimal risk on this setup.
📉 *Bias:* Bearish
If price taps the entry and rejects, we expect a downside move targeting lower intraday liquidity zones.
🔑 **Key Levels to Watch:**
* **Entry Zone:** 162.917
* **SL:** 162.969
* **Reaction Zone:** Watching lower timeframes for confirmation after entry

EUR/JPY BEARISH BIAS RIGHT NOW| SHORT
Hello, Friends!
We are going short on the EUR/JPY with the target of 163.215 level, because the pair is overbought and will soon hit the resistance line above. We deduced the overbought condition from the price being near to the upper BB band. However, we should use low risk here because the 1W TF is green and gives us a counter-signal.
Disclosure: I am part of Trade Nation's Influencer program and receive a monthly fee for using their TradingView charts in my analysis.
✅LIKE AND COMMENT MY IDEAS✅

EURJPY H1 Analysis – Wave 4 Retracement in Play🕐 Timeframe: 1H
📅 Updated: 17 May 2025
📌 Pair: EURJPY
⸻
🔍 Technical Outlook:
• Price is in a clear bearish trend, respecting lower highs and lower lows.
• Awesome Oscillator (AO) shows bearish convergence — momentum is weakening but still bearish overall.
• Price retraced to the 2.618–2.786 extension zone (162.902–162.982), a common wave 4 reaction level.
• This zone may act as a rejection area, setting up for the start of wave 5.
⸻
🔧 Elliott Wave Structure:
• ✅ Wave 1–3: Completed with strong bearish momentum.
• 🟡 Wave 4: Likely completed at 162.982 or may slightly extend, but momentum is fading.
• 🔴 Wave 5: Expected next move — continuation to the downside.
⸻
📍 Key Levels:
• 🔺 Wave 4 Resistance Zone: 162.902–162.982
• 🔻 Potential Wave 5 Target:
• 🎯 TP1: 162.000
• 🎯 TP2: 161.835 (Fib 4.236 extension)
• 🎯 TP3 (Extension): 161.50 or lower if selling accelerates
⸻
🧠 Strategy:
1. Monitor price action at 162.982 — if rejected, likely wave 4 completed.
2. Look for bearish engulfing / momentum candles for entry signal.
3. Short Setup Idea:
• Entry: Below 162.88–162.90 after confirmation
• SL: Above wave 4 high (163.12 or tighter at 163.00)
• TP: 100+ pip potential — trailing to lock profit
⸻
✅ Summary:
• AO confirms bearish convergence → weak momentum
• Price hit Fib confluence zone → wave 4 likely done
• Wave 5 could give 100+ pips to the downside
• Wait for confirmation, then short the breakdown
