JPYEUR trade ideas

EUR/JPY
🔹Symbol: EUR/JPY
🔹Price: 164.717
🔹Stop loss: 165.612
🔹Take profit 1: 164.200
🔹Take profit 2: 163.301
🔹Take profit 3: 162.562
🔹Take profit 4: 161.886
🔹Take profit 5: 161.322
Low risk: % 1.🟢
📊Check your chart before entering.
♦️Check before use to make sure there is no important news.

EURJPY Wave Analysis – 14 May 2025
- EURJPY reversed from resistance area
- Likely to fall to support level 162.00
EURJPY currency pair recently reversed down from the resistance area between the pivotal resistance level 165.00 (which has been reversing the price from November), upper daily Bollinger Band and the 50% Fibonacci correction of the downward impulse from July.
The downward reversal from this resistance area stopped the c-wave of the previous short-term ABC correction 2 from February.
Given the strength of the resistance level 165.00, overbought daily Stochastic and clear daily downtrend, EURJPY currency pair can be expected to fall to the next support level 162.00.

SHORT ON EUR/JPYOANDA:EURJPY has created a double top with bearish divergence at a major supply zone.
I will be selling EJ to the next level of support/demand for over 200 pips.

Still Thinking Bullish!Enjoying a Motive wave 3 and An Inverse Head&Shoulder Pattern strongly Suggest a HUGE bullish wave for EURJPY!
ENTRY: BUY Stop :164.200
SL: 163.320
TP1: 166.120
TP2: 166.74
TP3: 167

EURJPY Daily analysis OANDA:EURJPY 1H : Bearish MSS + OB + IMB 15m : Bearish MSS + BOS + IMB
The hourly chart is currently very strongly bearish and I think the price should retest and continue the trend
15: Like the hourly chart
EURJPYthree touch channel at the top of the structure .
ascending within an ascending.
waiting for the last touch to take a short position on EURJPY

EUR/JPY For Bearish as pull-backyou can go short now
general trend is up trend
current phase is pull-back
have fun :)

EURJPY 1H – Structure Broken!
⚠️ Bearish Divergence (Wave 3 vs 5) confirmed on AO
📉 Price broke key SNR at 164.671
Structure is gone — now waiting for a clean retest & rejection
🔻 Bearish bias below 164.671
Next target: 164.200 / 163.800
#EURJPY #Divergence #StructureBreak #ForexSetup

Engulfed at the Bottom… Now Watch the Bulls Bite Back Price just bounced off channel support with a clean 1H engulfing candle—classic bullish confirmation. If momentum holds, I’m looking for buyers to drive price toward 165.20–165.40 near the channel top. 📈
Let’s see if the bulls keep control.

EURJPY 1H – Bearish Divergence & Structure WatchEURJPY 1H – Bearish Divergence & Structure Watch
⚠️ Bearish Divergence Spotted | Structure Break Incoming? ⚠️
Spotted a clear bearish divergence between Wave 3 and Wave 5 on both price and the AO (Awesome Oscillator).
While price made a higher high, momentum failed to follow — a classic sign of weakening bullish pressure.
Now, price is sitting on a key structure zone at 164.65.
⛔ If this support breaks, expect a potential shift in trend.
Stay alert — once the structure is broken, sellers might step in hard. Be ready!
🔻 Eyes on the next move!
#EURJPY #PriceAction #Divergence #StructureBreak #TradingSetup #ForexAnalysis

External liquidity Order block traders will try to reverse the market and this is where they get hunted they will wait for an entry forever

EUR/JPY Faces the Upper Boundary of Its Lateral Range AgainOver the past five trading sessions, the EUR/JPY pair has climbed nearly 2% in favor of the euro, once again reaching a key resistance zone in the short term. For now, the bullish bias remains intact, driven by the weakened yen, which has lost demand in recent sessions. As a safe-haven currency, the yen has struggled to hold investor interest as trade tensions ease and market confidence rebounds.
Wide Lateral Range
Since 2024, EUR/JPY has maintained a broad lateral channel, bounded by resistance at 165.315 and support at 156.656. Recent buying momentum has brought the price back to the upper end of the range, and if bullish pressure continues, a breakout could occur—potentially giving way to a more sustained uptrend in the short term.
Technical Indicators:
ADX: The ADX line continues to hover below the neutral level of 20, signaling low volatility in recent movements. If the ADX fails to break above that level, a persistent state of neutrality may continue to dominate price action in the short term.
TRIX: The TRIX line remains above zero, but it shows a flattened curve, indicating the absence of a clear directional trend in the exponential moving averages. This opens the door for a neutral phase to develop at current resistance levels.
Key Levels to Watch:
165.315 – Major Resistance: Marks the upper boundary of the lateral range. Sustained bullish momentum above this level could lead to a stronger uptrend in the near term.
162.225 – Nearby Support: Aligns with the neutral zone of the past two weeks. May act as a barrier for short-term pullbacks.
160.655 – Critical Support: Corresponds to the midpoint of the current channel and aligns with the Ichimoku cloud area. A return to this level could undermine the current bullish structure and reinforce the broader sideways range.
Written by Julian Pineda, CFA – Market Analyst

TRADING PLAN: EURJPY LONG TRADE SETUP Given the bullish sentiment in EJ today, and the successfully breaking out of the Asian session high, we'll take a long position. Our initial target is a 1:1 risk-reward ratio, followed by a 1:2 ratio after securing some profits.

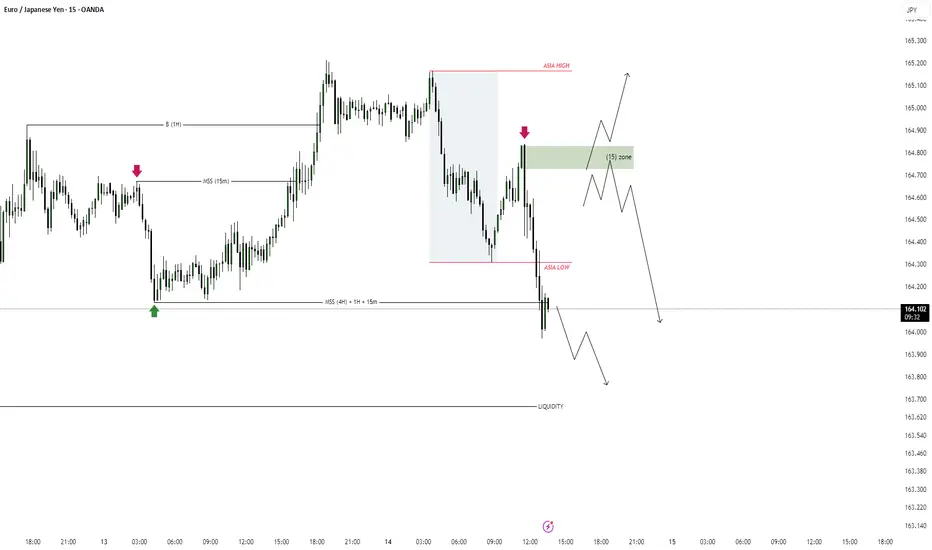
EURJPY Sell - May 13, 2025📍Context:
Reaction from Daily Orderblock
Clear 15m BOS
Two Asia lows & a gap in our direction
Entry at 15m OB with 0.5% risk
If price gives a 1m BOS within the OB, I’ll add another 0.5% to go full risk.
Even though there’s a 5m OB above, I’m comfortable taking the trade if we show signs of rejection.
🎯 TP: Targeting Asia lows and continuation down with clean structure.

EURJPY BUYThis pair is heading towards the support. If this pair fails to break the support level. We are buying to those zones.

EURJPY DAILY ANALYSIS OANDA:EURJPY 1H : Bullish BOS + OB + IMB + GAP 15m : Bearish MSS + OB + IMB
EXPACTION : Currently, the price has hit the 15-minute zone and formed a 3-minute MSS, but since it is near the Asian ceiling, I will wait for the BOS. If the 15-minute zone is broken, the trend will be bullish. But if it respects the 15-minute zone, I can be sure that we can fall to the 1-hour zone.
I will post my LTF trading idea in the private section. Be sure to follow and like the post.

EURJPY once again breaks key resistance.The bulls are having another attempt on moving FX_IDC:EURJPY higher. Do they have enough steam? Let's find out...
MARKETSCOM:EURJPY
Let us know what you think in the comments below.
Thank you.
77.3% of retail investor accounts lose money when trading CFDs with this provider. You should consider whether you understand how CFDs work and whether you can afford to take the high risk of losing your money. Past performance is not necessarily indicative of future results. The value of investments may fall as well as rise and the investor may not get back the amount initially invested. This content is not intended for nor applicable to residents of the UK. Cryptocurrency CFDs and spread bets are restricted in the UK for all retail clients.

Selling area eurjpyStrong sell expected now
Weekly selling area reached
Daily and weekly overbought pair

EURJPY Trading Opportunity! SELL!
My dear subscribers,
My technical analysis for EURJPY is below:
The price is coiling around a solid key level - 164.33
Technical Indicators: Pivot Points Low anticipates a potential price reversal.
Super trend shows a clear sell, giving a perfect indicators' convergence.
Goal - 163.45
About Used Indicators:
By the very nature of the supertrend indicator, it offers firm support and resistance levels for traders to enter and exit trades. Additionally, it also provides signals for setting stop losses
Disclosure: I am part of Trade Nation's Influencer program and receive a monthly fee for using their TradingView charts in my analysis.
———————————
WISH YOU ALL LUCK

EURJPY LONG TRADE UPDATE: 1:1 PROFIT ACHIEVED With our 1:1 profit target achieved, we'll now aim for a 1:2 ratio. To lock in some gains, let's secure half of the profits and allow the remaining position to run towards the full take-profit level.

EUR-JPYPay attention to the resistance I gave you.
If it rejects from that trend line, it could be a sell.
Keep an eye on it.

EURJPY → Storming the resistance. Ready for the rallyFX:EURJPY is rising amid a stronger dollar and positive news about the de-escalation of the trade war. The currency pair is storming the resistance of the range.
The currency pair is forming a retest of resistance. A breakout and consolidation above 164.19 - 164.50 could support the market amid the dollar's growth.
The dollar is strengthening after positive news related to the de-escalation of the trade war. Against this backdrop, the Japanese yen is losing ground, which is generally affecting EURJPY.
A move above the key level will confirm a breakout of the resistance of consolidation, which could trigger a distribution phase...
Resistance levels: 164.19, 166.7
Support levels: 163.15, 162.38
The price has already entered the buying zone, meaning that resistance has been broken. All that remains is to wait for confirmation that the bulls are ready... Consolidation above 164.19 - 164.5 will confirm this, and in that case, we can expect distribution towards 166.7.
Best regards, R. Linda!
