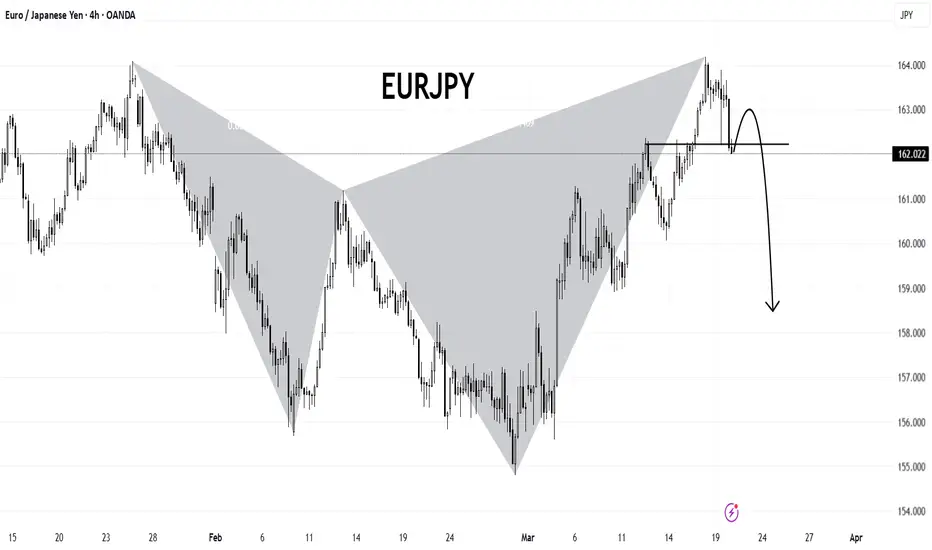
Short - EURJPY - Large Range- Bird eye view of my short analysis.
- Major trend shift.
- Currently in a large range.
- False break of previous week high at resistance with price action rejection.
JPYEUR trade ideas


Trading Idea: EUR/JPY Buy Setup Based on Retail Flow SentimentA strong buy signal has emerged on EUR/JPY, driven by retail trading flow analysis. Let's break down the setup and why this trade aligns with smart money strategies.
Signal Breakdown
Retail Sentiment Shift 📊
After breaking above the descending triangle, we observed a surge in retail sell positions, indicating a strong bearish bias among traders.
Despite a minor pullback, the majority of retail traders remain short, reinforcing the likelihood of a stop-out rally.
Price Action & Smart Money Reaction 🏦
The breakout invalidated the bearish triangle pattern, yet retail traders continued shorting.
Our trading flow model shows short positioning far exceeding rolling averages, a classic trap scenario where market makers may push prices higher to liquidate retail shorts.
Trade Setup
Buy Entry: 📈 161.50
Stop Loss: ❌ 159.70
Target: 🎯 175.56
Rationale: Retail traders are heavily short, margin utilization is rising, and smart money may continue squeezing higher.
Bonus: 💰 This setup also benefits from a positive carry swap, making it even more attractive for medium-term holding.
Final Thought
Our EUR/JPY trade strategy is built on 80% trading flow sentiment and 20% technical & fundamental analysis. Retail traders often get trapped at key reversal points, and we capitalize on these inefficiencies.
📊 Will the smart money push EUR/JPY higher? Drop your thoughts below! 👇

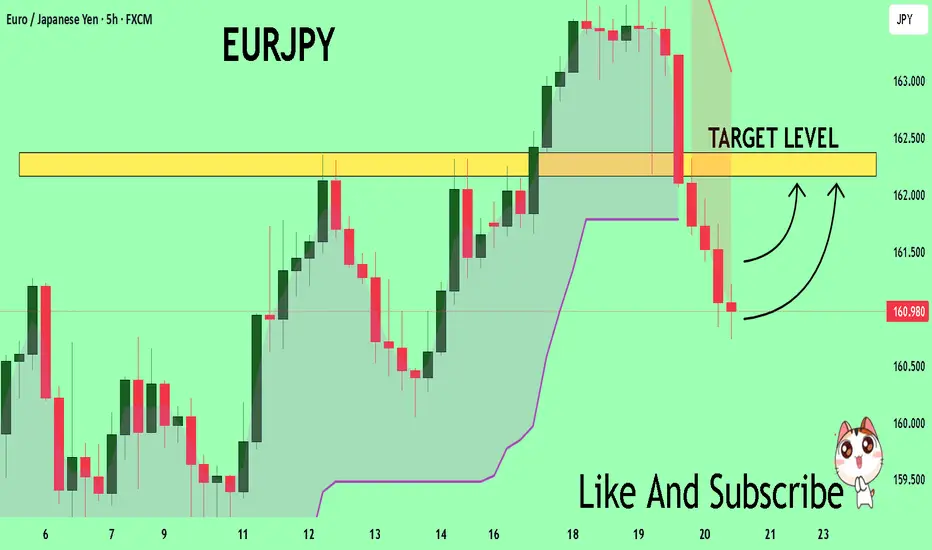
EURJPY: Potential downward move towards 161.00?OANDA:EURJPY is currently approaching a significant resistance zone, an area that has been a key point of interest where sellers have regained control, leading to notable reversals in the past. Given this, there is potential for a bearish reaction if price action confirms rejection, such as a bearish engulfing candle, long upper wicks or increased selling volume.
If the resistance level holds, I anticipate a downward move toward 161.00, a target that seems at least achievable. This would more likely be a call on a bearish outlook, as sellers may step in to push the price lower from this key level. However, if the price breaks this zone and sustains the up move, the bearish outlook may be invalidated, and we could potentially see a larger upside move.
Given the potential volatility around this zone, it’s crucial to monitor candlestick patterns and volume closely to identify strong selling opportunities. Proper risk management is essential to handle any potential volatility and protect your capital if the price breaks out.

EURJPY Breakout Analysis: Falling Wedge & Key LevelsChart Pattern Breakdown
The chart presents a 4-hour timeframe for EUR/JPY, revealing a strong technical setup with multiple key patterns in play. The price action has been forming a falling wedge, a bullish reversal pattern, followed by a breakout.
Falling Wedge Formation
A falling wedge pattern is characterized by a narrowing range, where both highs and lows trend downward but converge towards a breakout point. This setup indicates a loss of bearish momentum and the potential for a strong bullish move once the price breaks out.
The wedge began forming in early February, with price making lower highs and lower lows within the structure.
The support level remained stable, while the resistance trendline kept the price within a tightening range.
Around early March, the price successfully broke above the wedge resistance, confirming the bullish breakout.
Key Resistance & Support Levels
Resistance Level (Marked on the chart)
Around 163.500 - 164.000, where the price faced rejection multiple times.
The market tested this level but struggled to break through immediately, confirming its importance.
Support Level (Marked on the chart)
Around 158.500 - 159.000, acting as a strong demand zone.
This area provided multiple bounces before the final wedge breakout.
Current Price Action & Trading Setup
Breakout Confirmation: The price successfully broke the wedge and moved higher, testing the resistance zone.
Pullback & Retest: The market is currently pulling back, testing the recent breakout area. This could be an ideal entry point for a long trade.
Bullish Target: The next significant resistance is at 166.754, followed by an extended target at 166.938.
Trade Plan
✅ Long Entry: On a successful retest of support near 160.500 - 161.000
🎯 Target 1: 166.754
🎯 Target 2: 166.938
🔒 Sell Stop (Stop Loss): Below 158.918 to minimize risk
Conclusion
The EURJPY chart is showcasing a strong bullish setup with a confirmed falling wedge breakout. As long as price holds above the key support level, the market is likely to continue its bullish momentum towards the 166+ zone. Traders should watch for confirmations such as bullish candlestick patterns, volume surges, and trendline support before entering a long position.
🚀 Do you agree with this setup? Drop your thoughts in the comments! 🚀

EURJPY Continues its Bullish Trend.Dow theory performing
.No indications of divergence
.Go with the trend.

EURJPYEURJPY ,THE pear is under boj downward drop but remains bullish on daily and could see more gains if demand for EURO holds strongly.

BearishWeekly candle rejecting channel so price
is possibly headed to bottom of channel price 154.873

EURJPY Massive Long! BUY!
My dear friends,
Please, find my technical outlook for EURJPY below:
The price is coiling around a solid key level - 161.01
Bias - Bullish
Technical Indicators: Pivot Points Low anticipates a potential price reversal.
Super trend shows a clear buy, giving a perfect indicators' convergence.
Goal - 162.16
About Used Indicators:
The pivot point itself is simply the average of the high, low and closing prices from the previous trading day.
———————————
WISH YOU ALL LUCK
eurjpy buy signal
Don't forget about stop-loss.
Write in the comments all your questions and instruments analysis of which you want to see.
Friends, push the like button, write a comment, and share with your mates - that would be the best THANK YOU.
P.S. I personally will open entry if the price will show it according to my strategy.
Always make your analysis before a trade

EUR/JPY SENDS CLEAR BULLISH SIGNALS|LONG
EUR/JPY SIGNAL
Trade Direction: long
Entry Level: 161.131
Target Level: 162.550
Stop Loss: 160.184
RISK PROFILE
Risk level: medium
Suggested risk: 1%
Timeframe: 3h
Disclosure: I am part of Trade Nation's Influencer program and receive a monthly fee for using their TradingView charts in my analysis.
✅LIKE AND COMMENT MY IDEAS✅

EUR/JPY Bearish Setup Breakdown (2H Chart)1. Market Structure & Trend Shift
The pair was in a clear uptrend, forming higher highs and higher lows.
However, price broke below the ascending trendline, signaling a potential trend reversal.
A retest of the broken trendline confirms bearish strength, as price rejected from it.
2. Entry Strategies
✅ Break & Retest Entry (Best Option)
Since price already broke and retested the trendline, the best entry point was:
Sell Entry: After price rejected the broken trendline (confirmation candle).
Confirmation: A bearish candle with a long upper wick or strong red close.
Stop Loss (SL): Above the recent high (around 163.3).
Take Profit (TP): Targeting key support zones (159.0, then 156.0).
3. Risk Management
Stop Loss Placement: Above the last high (163.3), ensuring room for market fluctuations.
Take Profit Zones:
First TP: 159.0 (psychological level & previous support).
Final TP: 156.0 (major support & full bearish target).
Risk-to-Reward Ratio (RRR):
If SL = 2.0 pips and TP = 6.0 pips, RRR = 1:3 (ideal for strong trades).
Ensures potential profits outweigh risk.
4. Bearish Confirmation Signs
🔴 Lower Highs & Lower Lows → Trend is shifting down.
🔴 Bearish Engulfing Candles → Strong selling pressure.
🔴 Volume Increase on Down Moves → Sellers are in control.
🔴 Retest Rejection → Confirms trendline break is valid.
5. Potential Trade Outcome
✅ Bearish Scenario (Best Case)
Price continues falling towards 159.0, then 156.0.
The trade follows a clean trendline break & retest pattern.
Successful high RRR trade (1:3 or better).
❌ Invalidation (Worst Case)
If price reclaims 163.3, the bearish setup is invalid.
This could trigger a stop-loss hit or indicate a fake breakout.
Adjust strategy and wait for a stronger confirmation.
Final Trading Plan:
✅ Wait for confirmation before entering (trendline rejection or strong bearish candle).
✅ Manage risk properly (never risk more than 2-3% per trade).
✅ Stick to the plan and avoid emotional decisions.

DeGRAM | EURJPY decline in the channelEURJPY is in a descending channel between the trend lines.
The price is moving from the upper boundary of the channel and dynamic resistance, which has previously acted as a point of decline.
The chart keeps the harmonic pattern relevant, as well as the descending structure.
We expect the decline to continue.
-------------------
Share your opinion in the comments, and support the idea with a like. Thanks for your support!

DeGRAM | EURJPY retest of trend lineEURJPY is above the descending channel between the trend lines.
The price broke the upper boundary of the channel, formed a harmonic pattern and approached the dynamic resistance.
The chart maintains the descending structure.
We expect the decline to continue after consolidation under the nearest support level.
-------------------
Share your opinion in the comments, and support the idea with a like. Thanks for your support!

Bearish drop?EUR/JPY is rising towards the pivot which is a pullback resistance and could drop to the 1st support.
Pivot: 162.24
1st Support: 160.36
1st Resistance: 164.02
Risk Warning:
Trading Forex and CFDs carries a high level of risk to your capital and you should only trade with money you can afford to lose. Trading Forex and CFDs may not be suitable for all investors, so please ensure that you fully understand the risks involved and seek independent advice if necessary.
Disclaimer:
The above opinions given constitute general market commentary, and do not constitute the opinion or advice of IC Markets or any form of personal or investment advice.
Any opinions, news, research, analyses, prices, other information, or links to third-party sites contained on this website are provided on an "as-is" basis, are intended only to be informative, is not an advice nor a recommendation, nor research, or a record of our trading prices, or an offer of, or solicitation for a transaction in any financial instrument and thus should not be treated as such. The information provided does not involve any specific investment objectives, financial situation and needs of any specific person who may receive it. Please be aware, that past performance is not a reliable indicator of future performance and/or results. Past Performance or Forward-looking scenarios based upon the reasonable beliefs of the third-party provider are not a guarantee of future performance. Actual results may differ materially from those anticipated in forward-looking or past performance statements. IC Markets makes no representation or warranty and assumes no liability as to the accuracy or completeness of the information provided, nor any loss arising from any investment based on a recommendation, forecast or any information supplied by any third-party.

EURJPYEURJPY has completed the bearish harmonic pattern. And price has started showing weakness at daily resistance level as well.
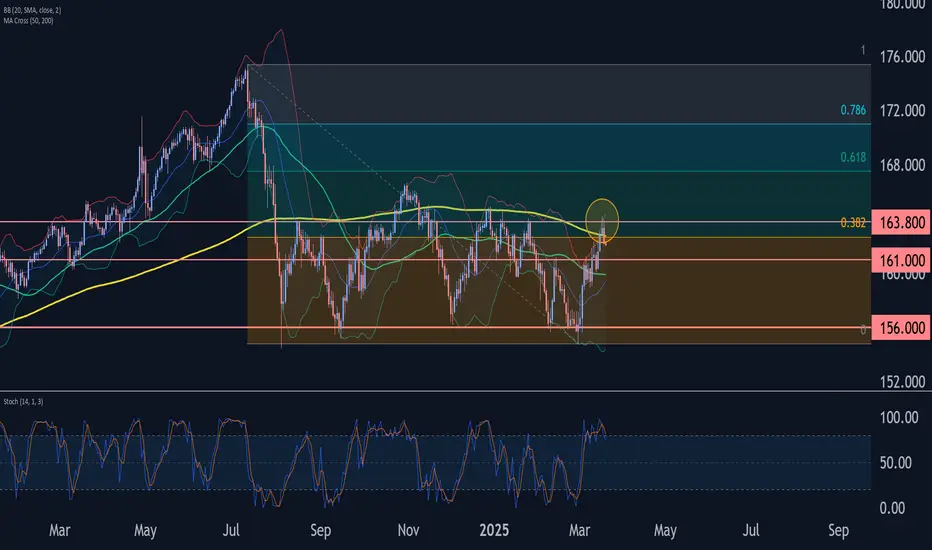
EURJPY Wave Analysis – 19 March 2025
- EURJPY reversed from resistance zone
- Likely to fall to support level 161.00
EURJPY currency pair recently reversed down from the resistance zone between the resistance level 163.80 (which has been reversing the price from January) and the upper daily Bollinger Band.
The downward reversal from this resistance zone created the daily Japanese candlesticks reversal pattern Shooting Star.
Given the overbought daily Stochastic, EURJPY currency pair can be expected to fall to the next support level 161.00.

EURJPY - Expecting Retraces Before Prior Continuation HigherHi Traders, on March 12th I shared this "EURJPY Short Term Buy Idea"
We expected to see correction prior to the bullish continuation. You can read the full post using the link above.
Price is moving as per the plan!!!
Based on the current scenario my bullish view still remains the same here.
We have bearish divergence in play based on the moving averages and histogram of the MACD and I expect to see retraces now before further continuation higher.
If you enjoy this idea, don’t forget to LIKE 👍, FOLLOW ✅, SHARE 🙌, and COMMENT ✍! Drop your thoughts and charts below to keep the discussion going. Your support helps keep this content free and reach more people! 🚀
---------------------------------------------------------------------------------------------------------------------
Disclosure: I am part of Trade Nation's Influencer program and receive a monthly fee for using their TradingView charts in my analysis.-

EURJPY 4H | Bullish Breakout & Retest – Next Big Move?The EUR/JPY 4-hour chart presents a compelling bullish breakout setup following a structured downtrend. The market recently broke through a significant resistance zone, indicating potential further upside movement. This analysis outlines key price levels, market structure, and an actionable trading plan.
📊 Market Structure Overview
🔸 Downtrend Reversal: The price was previously trading within a descending channel (highlighted in green), forming lower highs and lower lows.
🔸 Support Confirmation : The price bounced from a strong support zone around 158.500 - 160.000, confirming buyers' interest in this region.
🔸 Breakout & Retest : A strong bullish impulse broke through the 164.500 - 165.000 resistance zone, suggesting a shift in market sentiment.
📌 Key Trading Levels
🔹 Support Zone: 158.500 - 160.000
This area previously acted as a demand zone where buyers aggressively pushed the price higher.
It now serves as a safety net for long positions.
🔹 Resistance Zone (Now Potential Support): 164.500 - 165.000
Price has broken above this level, but a retest could provide an ideal entry for confirmation.
🔹 Next Major Resistance (Target Levels):
TP1: 165.000 → A psychological level and previous resistance.
TP2: 166.020 → A higher resistance zone where price may struggle to break through.
📈 Trading Plan – Long Setup
✅ Entry Confirmation:
Wait for price to pull back to the 164.500 - 165.000 zone.
Look for bullish candlestick patterns (e.g., pin bars, engulfing candles) to confirm buyers stepping in.
🎯 Take Profit Targets:
TP1: 165.000 (Initial resistance level)
TP2: 166.020 (Potential extended bullish move)
🛑 Stop Loss Strategy:
Below 160.038 (Previous structure low & key support level)
Ensures protection against potential fakeouts or trend reversals.
📢 Risk-Reward Ratio:
Aiming for 2:1 or better risk-reward ratio for an optimal trade setup.
📝 Market Outlook & Conclusion
📌 The recent breakout above resistance suggests bullish momentum is strong. However, traders should be patient and wait for a pullback to enter at a better risk-reward level. If price successfully retests and holds above 164.500, there is a high probability of continuation towards 166.020.
🚀 Trading Bias: Bullish – Until market structure shifts or a major rejection occurs at resistance.
📢 Final Trading Tip
🔹 Patience is key! Don’t rush into a trade immediately after a breakout. Wait for confirmation, as false breakouts are common in volatile markets. A successful retest of the broken resistance will provide a low-risk, high-reward entry opportunity.

EURJPYTHE 162.231 buy zone running over 50pip complete reaction,the boj data print caused euro to drop ,

EURJPY sell signal. Don't forget about stop-loss.
Write in the comments all your questions and instruments analysis of which you want to see.
Friends, push the like button, write a comment, and share with your mates - that would be the best THANK YOU.
P.S. I personally will open entry if the price will show it according to my strategy.
Always make your analysis before a trade

EURJPYEURJPY came to our demand floor in london session and took a buy,the boj economic data print took out loss for eur buyers,
