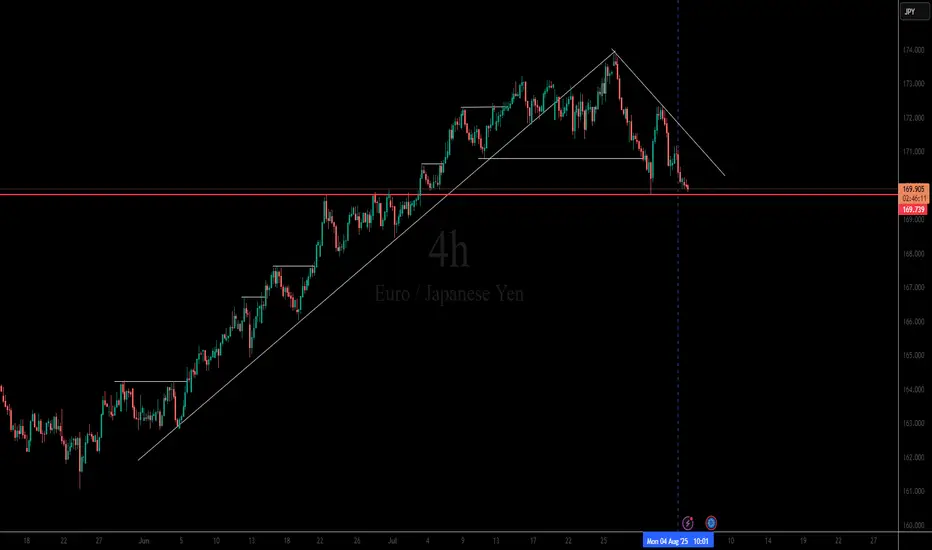
Multi-Timeframe Breakdown: LOOK AT NEXT PUBLISHED IDEA FOR M15 📌 H4 Chart SELL ENTRY LOADING....
Market Structure: Clean uptrend that broke structure to the downside.
Trendline Break: The bullish trendline has been broken and respected as resistance, showing bearish strength.
Support Level: Price is sitting right on a strong horizontal support (~169.74) — tested multiple times in the past.
Bearish Channel Forming: Price is forming lower highs and lower lows, suggesting a bearish trend continuation.
Liquidity Context:
There was likely sell-side liquidity below that horizontal support, which price might aim to sweep.
Buyers defending this area aggressively before; if they fail again, a breakout could accelerate.
JPYEUR trade ideas
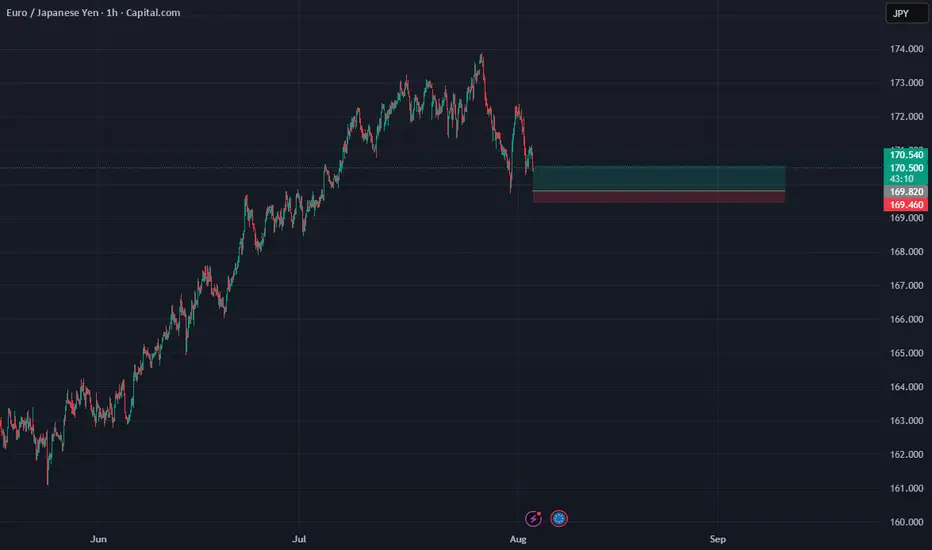
EURJPY ANALYSISAfter seeing the previous weekly candle close bearish and the daily from Monday close below the low of the last bearish candle which is a sign of sellers strength, we could expect further sells to continue but a simple retracement on the 4hr back to an area of interest for a potential LH structure point before further sells

ENTRY EURJPYDisclaimer:
This is merely a chart-based analytical trading idea and is not considered investment advice. Please manage your risks carefully and conduct your own research before making any trading decisions.
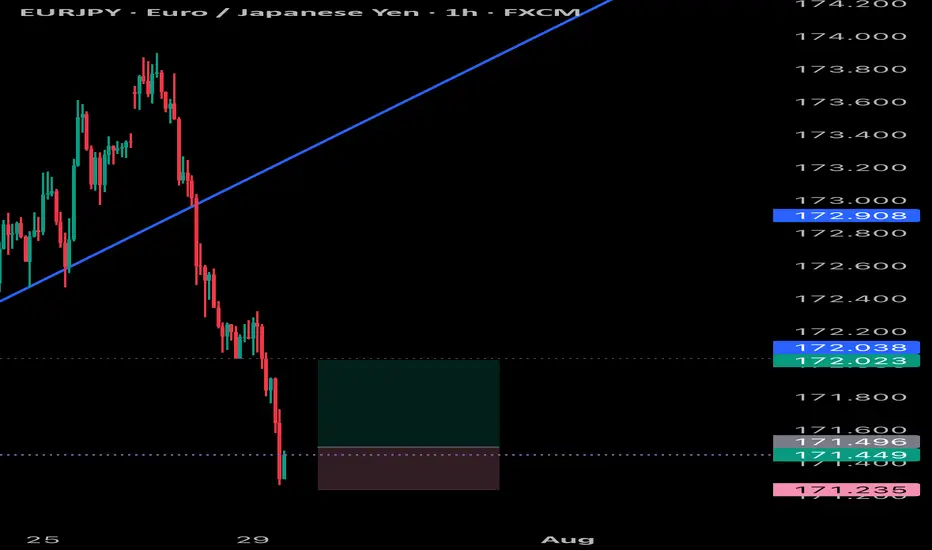
EURJPY POTENTIAL SELL OPPORTUNITY-H1 timeframe!Price is set for a sell from the current market price! Technically, we can identify the already existing bear trend. Couple of hours ago, we saw price rejection around 171.162 that rejection could be a H1 lower high which potentially means price might drop back to the low. Therefore, a sell opportunity is envisaged from the current price

EURJPY in bearish trendwith no major sign of reversal trend is bearish, and with a bearish flag pattern, it has added another confluence of the continuity of its current trend trade can be taken when the price breaks the lower trendline of flag

EURJPY about to enter into a DowntrendRecently EURJPY reached high points in the chart at 173.016
From there it fell and continued downwards.
I took a quick demo trade with an inverse risk to reward. Not the ideal thing to do, but I didn't want to keep my TP higher than 173.016 since we know it's a strong resistance level.
Got a quick win there.
Now, on the 4H, we can see that one huge red candle look out the previous five green candles.
It indicates that selling pressure is incoming.
This would be a good time to sell now. But I do want to see price go below 171.540 just to get that extra confirmation. Just in case, price decides to consolidate or go high for a while.
Have to stay vigilant with this market now.
TP1 will be 171.100.
TP2 will be 170.000
TP3 will be 168.800
Lets see how this trade plays out.

EURJPY Next Trade PlanThis Is not Advice. This is my view for next trade for a Swing, Maybe Market Goes Up With 1H OB. And Next Target Is Today High. It's My Analysis Maybe I,m wrong Because Market Is not 100% predictable.

EURJPY SELLas the main trend line is brake and the lower low is accepted. I think it moves down and good for sell
EURJPY

EURJPY SWEET BLUESEurjpy has hit all take profits with very little drawdown and huge profits very quickly nice pattern, simply followed

Long EJEJ showed false break the trendline with nice rejection, fulfills my criteria to go long with fibo. Anticipate with TP at fibo 261.8

EURJPY ANALYSISAfter seeing the daily still pushing to the downside and breaking below key support of 171.250 we could be looking out for a retest and continuation to the down side target of 170.000

EUROYENEurjpy has shorter pullbacks within an ascending structure ,shall keep following it and expect it to reach a fair mount of highs or levels

EURJPY SCALP Eurjpy quick scalp trade as it can still drop so it would be wise to not target higher than normal take profits , but will scalp it

EURJPY ANALYSISAfter seeing the previous daily candle close as an engulfing and trading below the moving average we could be looking for further sell off but with the fundamentals coming out for the day we could see slowed movement till the news comes out

EURJPY Bearish continuationAfter daily closed with strong bearish engulfing, i'm expecting another bearish movement today.
Asian session we saw price moving down broke 172 price level.
I plan to wait at 172 area to enter sell.
calculate your own risk & reward.
Good Luck

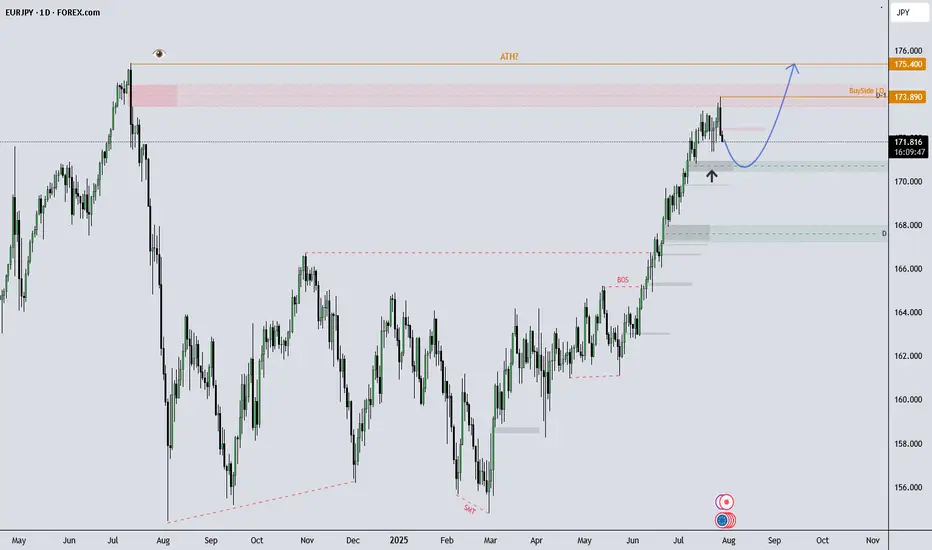
EURJPY Eyes New Highs After Pullback?What I see!
EURJPY Technical Outlook –
EURJPY remains in a strong uptrend and recently tapped into buy-side liquidity at 173.89, which now marks the All-Time High (ATH). After a brief rejection from that level, price is currently showing signs of a healthy pullback.
I’m observing the 170.00–171.00 zone, which aligns with previous demand. If price continues to respect this area, the overall bullish structure remains intact, with potential for a move back toward (and possibly beyond) the ATH.
A sustained break below 170.00 could indicate room for a deeper pullback, potentially toward the 168.00s, which would be a key area to monitor.
This analysis is shared for educational and discussion purposes only.

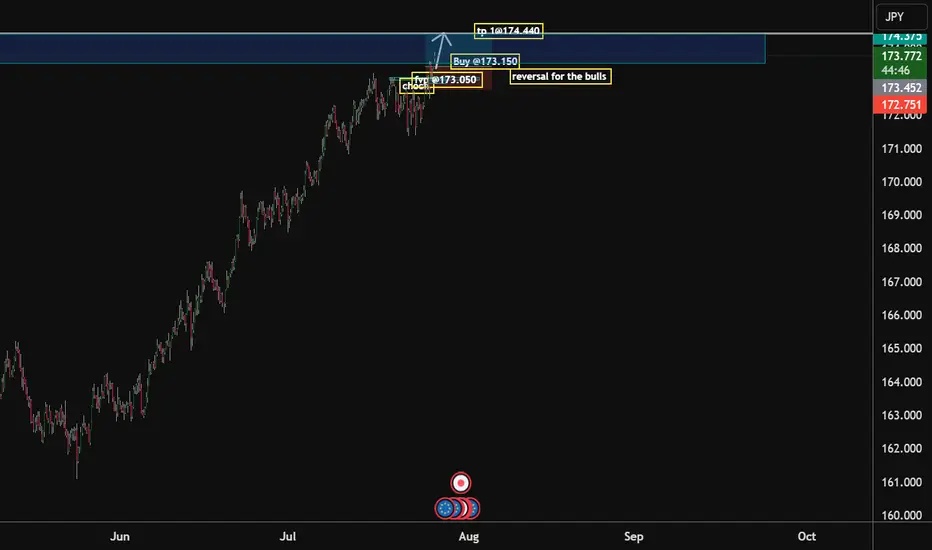
Eur/jpy Bulls to dominate @174.440 Handle As we begin a new week, I see the bulls coming in and grabbing the unmitigated liquidity @174.440 handle. My advice to fellow traders is that if the ECB stays hawkish or the BOJ remains dovish, EUR/JPY has room to stretch higher.
Watch Euro inflation numbers, BOJ yield curve control updates, and U.S. data spillovers.
Buy @ 173.15
TP 1.~174.440
4-hour channel midlineThe price has reached the midline of the 4-hour channel, and buying volume has decreased in this area.
We need to see whether the price can break above the midline or not.
If it breaks to the upside, our first target will be the top of the channel.
If it gets rejected, our target will be the bottom of the channel.

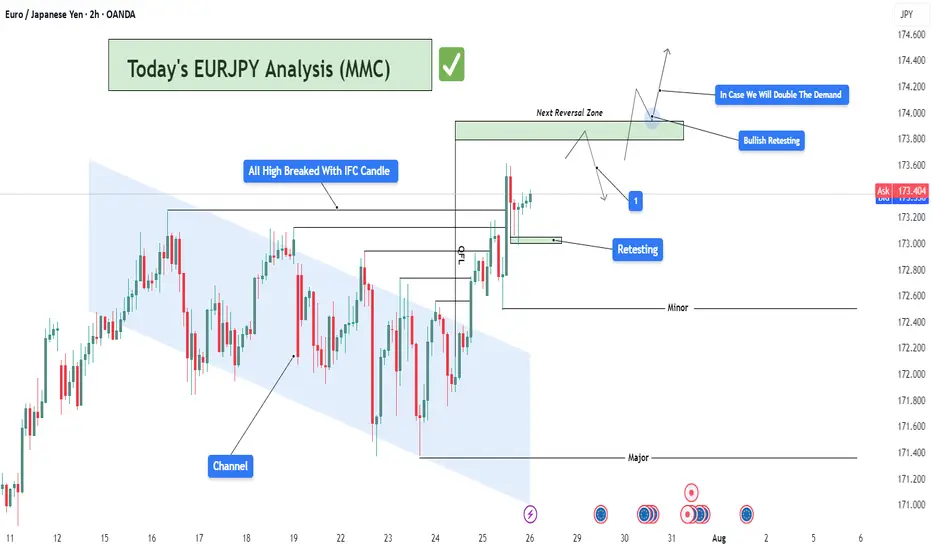
EURJPY Bullish Breakout with IFC Confirmation | MMC Retest Play🔍 Market Structure & Price Behavior Explanation
🔹 1. Channel Structure and Bearish Trap:
The pair was previously trading within a downward sloping channel, forming lower highs and lower lows. This structure was respected for several sessions, creating a bearish bias for most retail traders.
However, as per Mirror Market Concepts, such channels often act as liquidity traps — designed to build sell-side liquidity before a strong reversal.
🔹 2. IFC Candle Break — Smart Money Confirmation:
A powerful bullish impulse candle (IFC - Institutional-Filled Candle) broke through all previous swing highs formed inside the channel. This is a critical sign that institutional buyers have stepped in and the bearish trend is likely over.
This candle is not just a breakout but also a signature of smart money transitioning the market structure from bearish to bullish. The breakout occurred with high momentum and volume, piercing through the upper channel boundary, invalidating the bearish trend.
📘 Key Note: IFC candles usually represent imbalance, strong directional intent, and are often followed by continuation after retest.
🔹 3. Retesting Phase – Key to Confirmation:
After the breakout, price retested the broken structure, which is now acting as a new demand zone. The retest is clean, holding firmly above minor support — giving confirmation of bullish control.
This zone is also aligned with a QFL (base structure) concept, where price returns to the base before a new leg of the trend begins.
🔹 4. Current Price Action: Building for Next Leg
Price is now consolidating just below the next key reversal zone (marked in green). This zone represents potential supply or resistance.
There are two likely outcomes here:
Rejection at the reversal zone, with a potential pullback before continuation.
Clean break above, followed by "Demand Doubling", where price re-tests this level again, confirming further upside momentum.
In case the second scenario plays out (as marked on the chart), EURJPY could aggressively rally toward 174.400 and beyond.
🔹 5. Demand Zones & Key Levels:
✅ Minor Demand Zone (~173.00):
Currently respected — origin of last bullish move.
✅ Major Demand Zone (~171.200):
Acts as macro support in case of deep retracement.
✅ Reversal Zone (~173.800 – 174.200):
Price may slow down, reject, or consolidate here. Smart money usually decides at this level.
📈 MMC Trading Plan (Mirror Market Concept Approach):
Buy Bias is active as long as price remains above the minor demand zone.
Any rejection from reversal zone with wick traps followed by bullish engulfing setups = potential long entries.
Break & hold above 174.200 will likely trigger momentum-based entries, targeting extended bullish continuation.
💹 Trade Setup Parameters:
📥 Entry #1: After successful retest and bullish confirmation at demand
🛑 Stop Loss: Below retest structure (~172.850)
🎯 Take Profit 1: 173.950 (within reversal zone)
🎯 Take Profit 2: 174.350+ (post-demand doubling continuation)
🧠 Trader’s Mindset – What to Expect Next:
The chart is a classic example of MMC in real-time, where:
Price traps sellers inside a fake bearish channel
Breaks structure using high-volume impulsive moves
Retests demand zone cleanly
Builds up toward the next decision-making zone
Patience is key here. Let price either break and confirm above the reversal zone or give us another deep retest for the best R:R long setup.
Lower Timeframe Analysis on EUR/JPYIn this trade, I intend to open a long position.
Looking at the lower timeframes (15-minute chart), I see a potential buying opportunity. After reaching the area near the 173.609 level, the pair reversed down to around 172.978, and then bounced back up. This movement may indicate the start of a reversal followed by a pullback.
Moving on to the higher timeframes (daily and weekly), the bullish candles are showing some strength, and the following technical indicators:
* 45-period Exponential Moving Average
* 70 and 95-period Simple Moving Averages
* Parabolic SAR
Are moving in line with the intended direction and objective, which may suggest a continuation of the upward trend.
That said, it's important to remember that despite this technical analysis, it's crucial to monitor economic data, news, and other fundamental factors that could affect this pair, since this assessment focuses solely on the technical side.
The long position tool displayed on the chart is just an additional aid to help support the entry decision.

EUR_JPY WILL GROW|LONG|
✅EUR_JPY will keep growing
Because the pair is in the uptrend
And recently broke the key level of 173.200
So we will be expecting
Bullish continuation
LONG🚀
✅Like and subscribe to never miss a new idea!✅
Disclosure: I am part of Trade Nation's Influencer program and receive a monthly fee for using their TradingView charts in my analysis.
