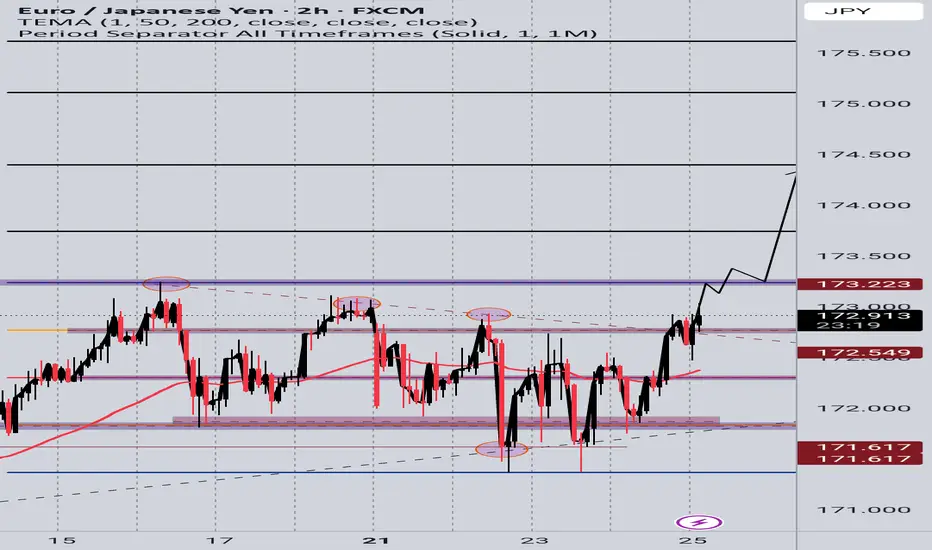
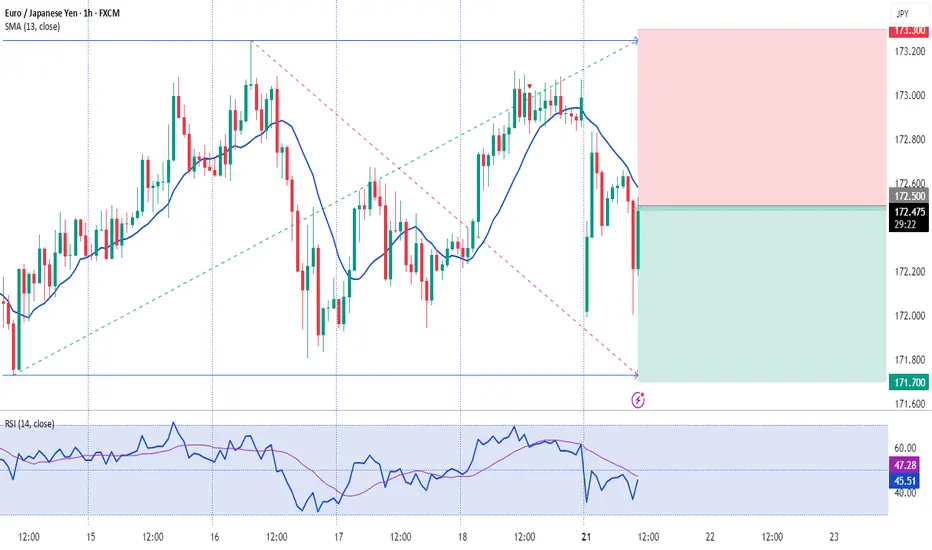
EURJPY Technical Analysis! SELL!
My dear subscribers,
EURJPY looks like it will make a good move, and here are the details:
The market is trading on 173.19 pivot level.
Bias - Bearish
Technical Indicators: Both Super Trend & Pivot HL indicate a highly probable Bearish continuation.
Target - 172.73
About Used Indicators:
The average true range (ATR) plays an important role in 'Supertrend' as the indicator uses ATR to calculate its value. The ATR indicator signals the degree of price volatility.
Disclosure: I am part of Trade Nation's Influencer program and receive a monthly fee for using their TradingView charts in my analysis.
———————————
WISH YOU ALL LUCK
JPYEUR trade ideas

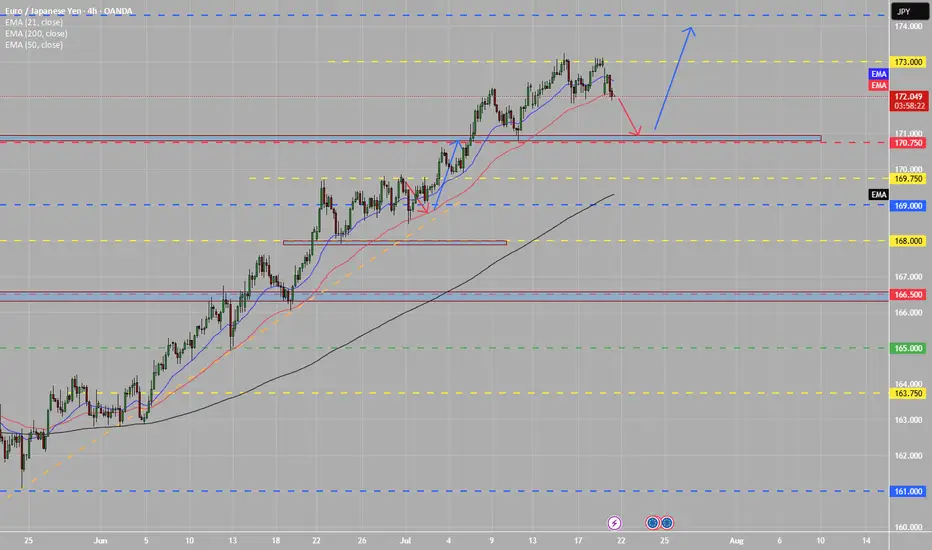
BULLISH SCENARIO EURJPY has been on a consolidation for some few days almost a week, and it looks like the asset has been printing out a flat correction for W4 before it breaks it the upside. The print out of the breakout looks like a LEADING diagonal, which leads to a new Impulse constructing W5. If all goes well we should be looking upstairs before a fall.
Don't forget to apply your trading tactics.

EURJPY Buy SetupEURJPY Buy Setup
📈 Entry: 172.807
🎯 Targets:
TP1: 173.742
TP2: 174.389
🔒 Reason: Price has broken out of a bullish symmetrical triangle pattern, signaling continuation to the upside. Watching for momentum to push toward key resistance levels.
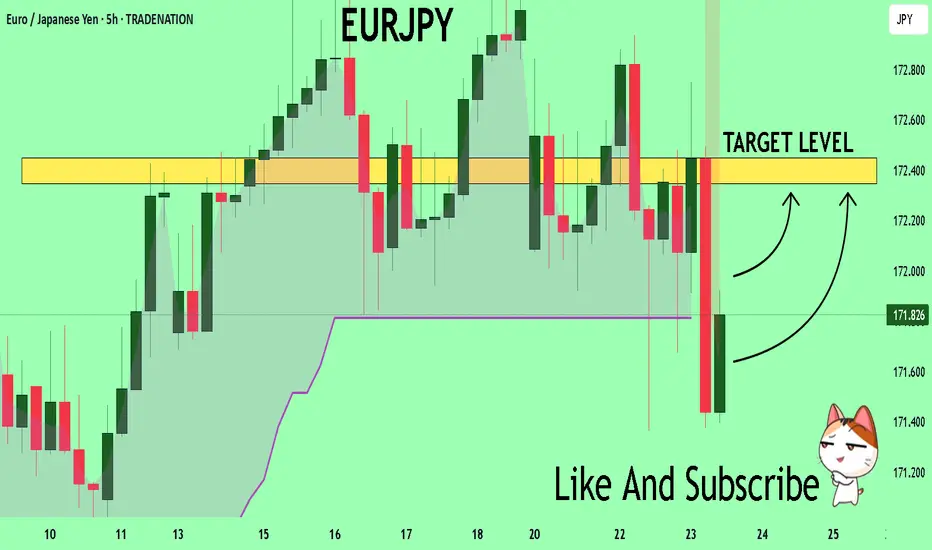
EURJPY Will Explode! BUY!
My dear subscribers,
My technical analysis for EURJPY is below:
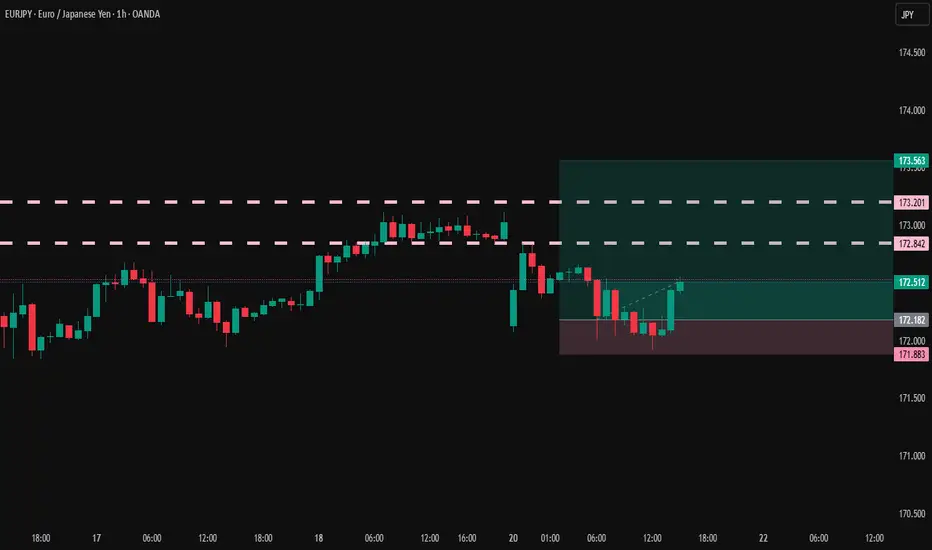
The price is coiling around a solid key level - 171.82
Bias - Bullish
Technical Indicators: Pivot Points Low anticipates a potential price reversal.
Super trend shows a clear buy, giving a perfect indicators' convergence.
Goal - 172.34
About Used Indicators:
By the very nature of the supertrend indicator, it offers firm support and resistance levels for traders to enter and exit trades. Additionally, it also provides signals for setting stop losses
Disclosure: I am part of Trade Nation's Influencer program and receive a monthly fee for using their TradingView charts in my analysis.
———————————
WISH YOU ALL LUCK
When the market owes you money. When the market plays as if it owes you money and it sure owes you some after perfect analysis.

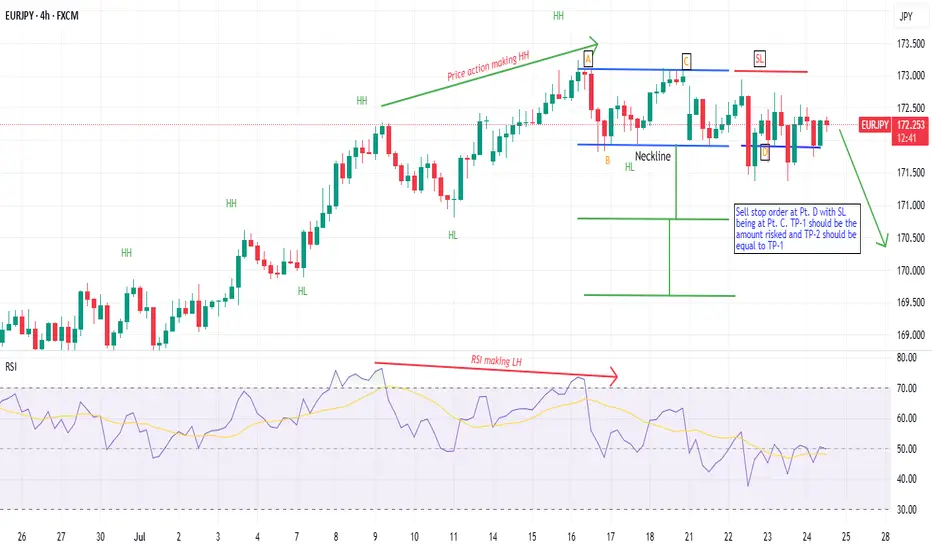
EURJPY - Short Idea - 24th July 2025- Stopped making news HHs
- Suspected Double Top pattern found
- Likely to go bearish
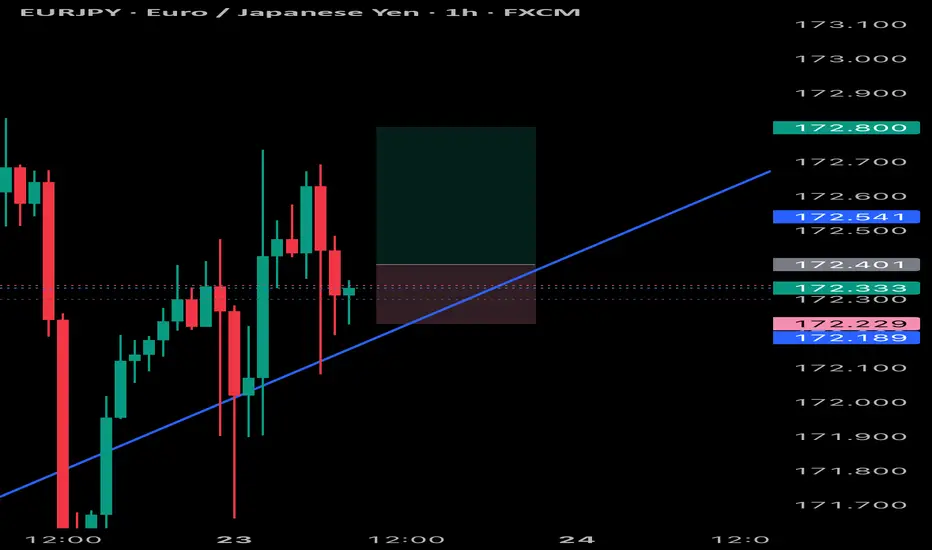
EURJPY will retest yesterday's lowest priceBased on Asian session price action, price broke the 172.00 mark.
due to this, i believed it will continue downtrend at least to test yesterday's lowest price (around 171.37).
I'm instant sell from current market price.
calculate your own risk & reward.
Good Luck.

EUR/JPY: Bullish Thesis on Policy DivergenceOur primary thesis is built on a powerful confluence of compelling fundamental drivers and a clear technical structure. We are taking a long position in EUR/JPY with high conviction, anticipating significant upside fueled by a stark monetary policy divergence confirmed by a constructive chart formation.
📰 Fundamental Analysis: The core of this trade is the widening policy gap between the European Central Bank (ECB) and the Bank of Japan (BoJ). While the BoJ is only just beginning to exit its ultra-loose monetary policy, the global environment points toward continued JPY weakness. The upcoming high-impact US news will act as a major catalyst. A "risk-on" reaction to the data would significantly weaken the JPY, providing a strong tailwind for this trade.
📊 Technical Analysis: The chart structure for EUR/JPY is decidedly bullish. The pair has established a clear uptrend, and recent price action indicates a period of healthy consolidation above key support levels. This presents a strategic entry point, as the market appears to be gathering momentum for the next leg higher. The current setup suggests a low-risk entry into a well-defined upward trend.
🧠 The Trade Plan: Based on this synthesis, we are executing a precise trade with a favorable risk profile.
👉 Entry: 172.422
⛔️ Stop Loss: 171.292
🎯 Take Profit: 174.684
⚖️ Risk/Reward: 1:2

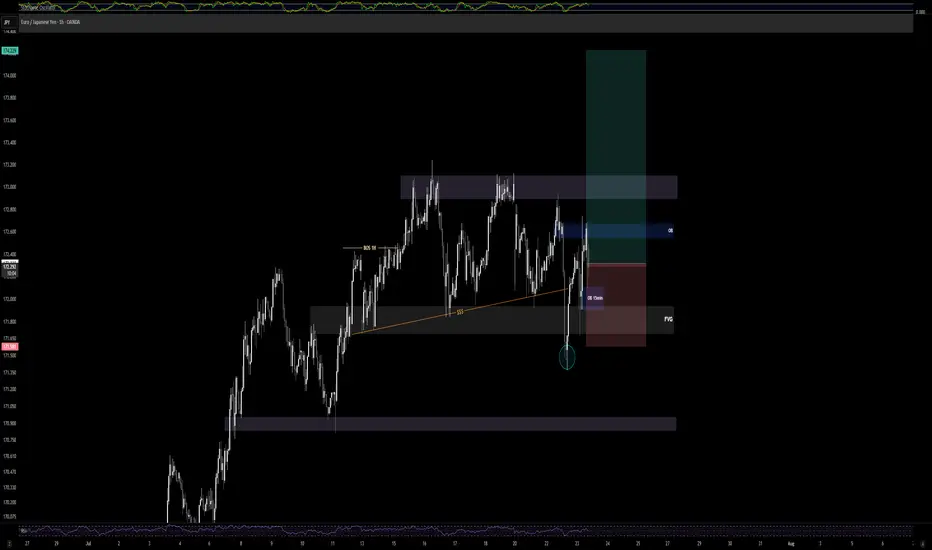
EUR/JPY - Good OpportunityPrice tapped into 1H demand zone and the 15min OB inside the FVG before showing a strong rejection. Bullish structure still intact with a clean 2:1 RR targeting previous supply zone. Patience paid off on this textbook entry.
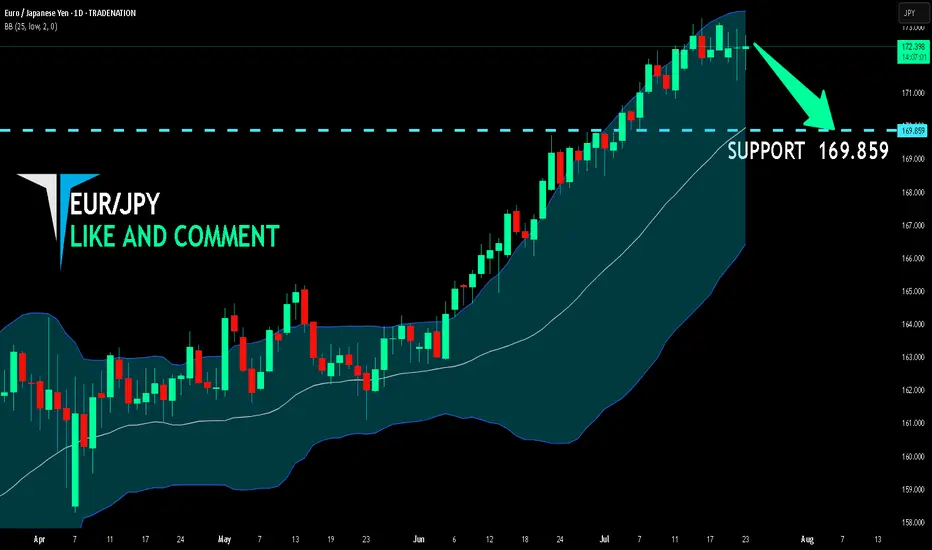
EUR/JPY BEST PLACE TO SELL FROM|SHORT
Hello, Friends!
EUR-JPY uptrend evident from the last 1W green candle makes short trades more risky, but the current set-up targeting 169.859 area still presents a good opportunity for us to sell the pair because the resistance line is nearby and the BB upper band is close which indicates the overbought state of the EUR/JPY pair.
Disclosure: I am part of Trade Nation's Influencer program and receive a monthly fee for using their TradingView charts in my analysis.
✅LIKE AND COMMENT MY IDEAS✅
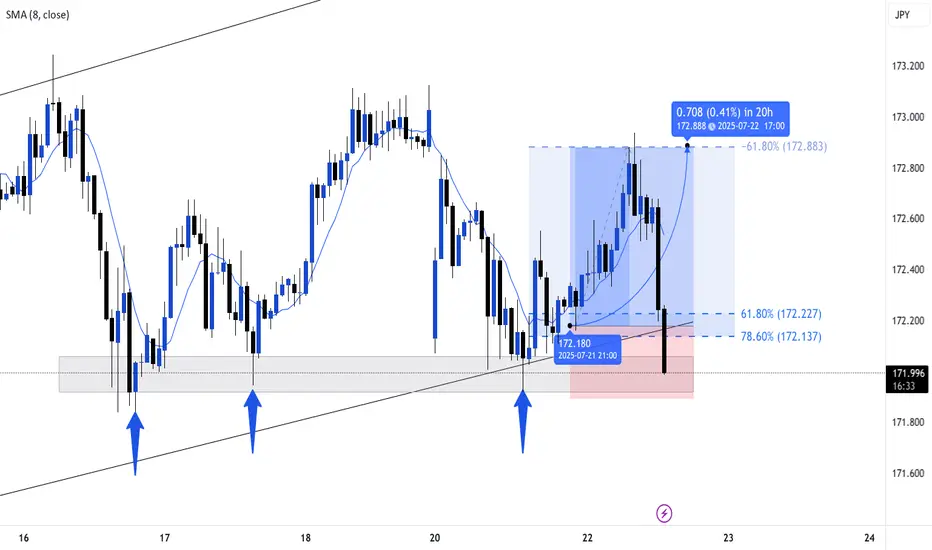
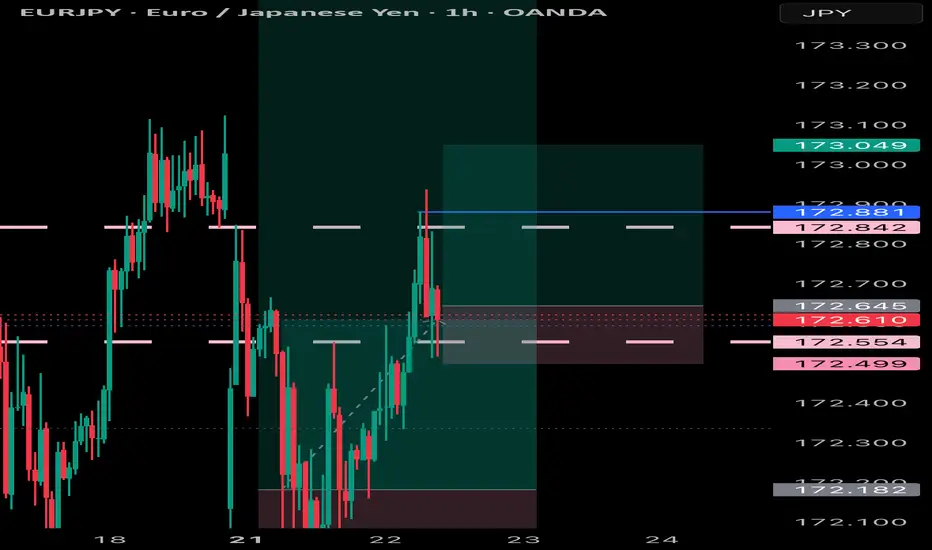
EURJPY
📍 Strategy: BoS + Retest Sniper Entry
🔍 Market Context:
Break of Structure (BoS) confirmed
Price returned to retest broken structure zone
RSI showing overbought divergence (above 70)
Perfect rejection from AREA OF INTEREST near 172.90–173.00
🔻 TRADE DETAILS
🟣 Sell Entry: 172.349
🔺 Stop Loss: 172.948 (Above structure high)
🎯 Take Profit: 169.146
🧮 Risk/Reward: ~1:5.6
🧠 Confidence: 75% setup based on structure + RSI + fakeout wick

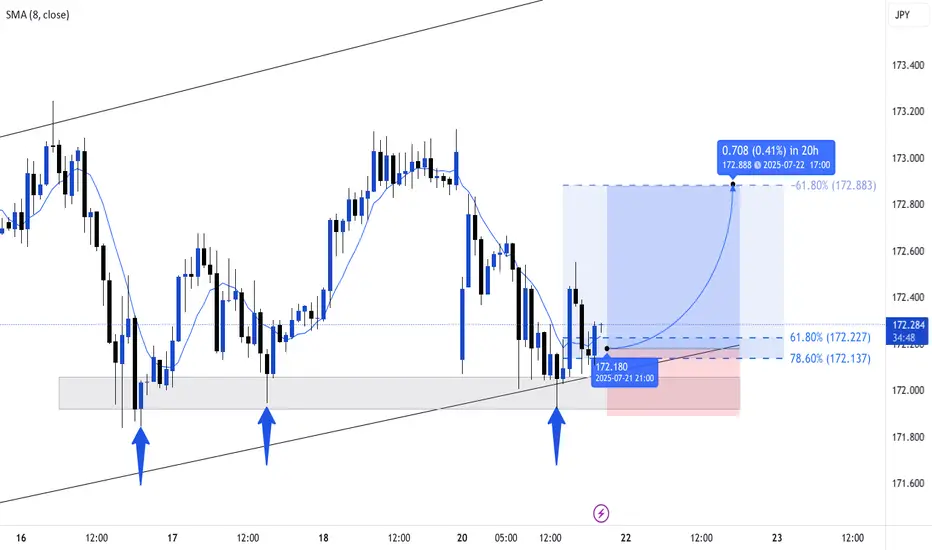
RESET PRICE FOR EJEurjpy has gone down but only to clear stops and lows but we keep following the trend because it is the only true direction for now
UP TREND Simple up trend that is being followed and respected here by the price , we BULLS are in control
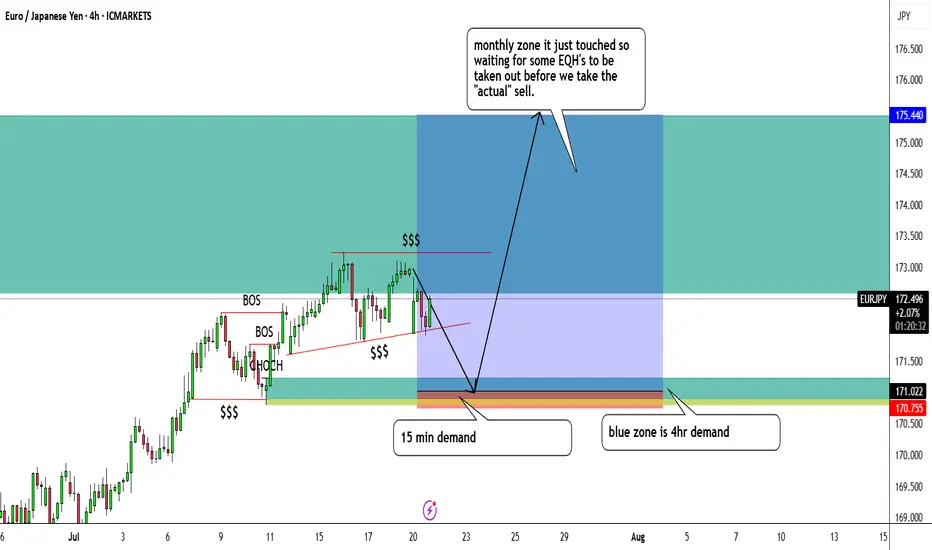
EURJPY buysHello everyone,
I am looking for eurjpy buys only because on the 15 min chart, price decided to take out EQL's to go long thus creating a big bullish move which has been marked in yellow and annotated.
Price than made this wedge liquidity zone where both EQL's and EQH's are present so we believe outside of this range is where the liquidity actually is.
4hr and 15 min demand zone is still untouched so we're looking for the buy around the 171.185 area to be precise.
I will be putting up screenshots as well so that it makes sense.
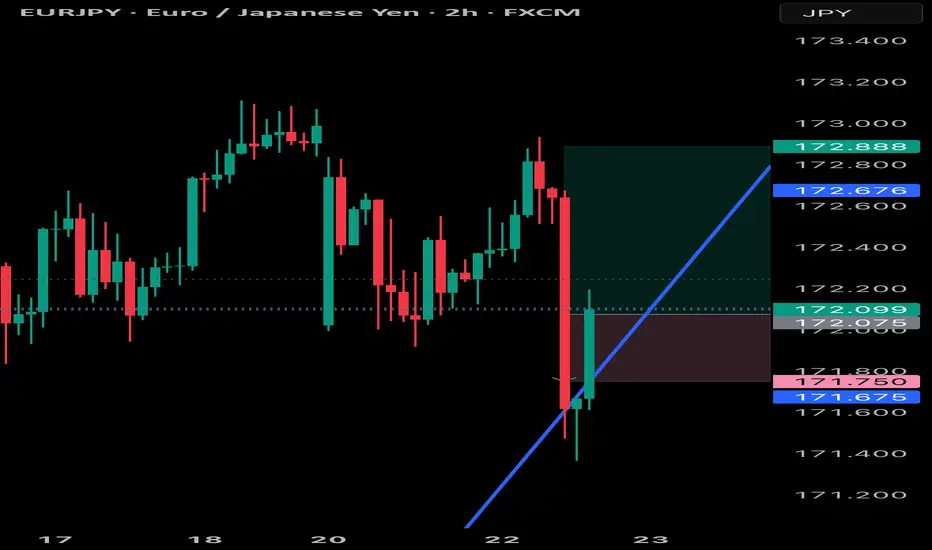
EURJPY – TCB Setup (Higher Timeframe Validation)🕐 EURJPY – TCB Setup (Higher Timeframe Validation ✅)
Strategy: Trend → Countertrend → Breakout (TCB)
Timeframe: 1H
Status: Breakout confirmed — now watching EP1/EP2 for clean entry signals
🔍 Setup Breakdown:
📈 Trend: Clean bullish channel structure still intact
↘️ Countertrend: Descending wedge fully broken to the upside
🚀 Breakout: Price is now testing key structure → breakout above 172.429 & 172.681 zones
📌 Trade Plan:
EP1: 172.429 — safer, structure-based retest
EP2: 172.681 — aggressive entry if price holds above
SL: 172.150
TP1: 173.400
TP2: 174.000
R:R: 1:2.5+ depending on entry location
Checklist Score: 95% — confirmed breakout, now waiting for execution model in NY or Asia session
🧠 TCB Note:
Higher timeframe confluence makes this setup stronger. Look for price action confirmation (e.g. bullish engulfing or rejection wicks) at EP1/EP2 before executing.
#EURJPY #ForexTCB #BreakoutTrading #PriceActionFX #SmartMoneyFlow

EJ BULLISH SETUP Looking for a nice retest at the daily support zone, if this holds true price will start to look for monthly resistance marked in blue.
EURJPY at Risk of Breakdown Below Key Support📈 EURJPY Approaches Key Technical Breakout Point
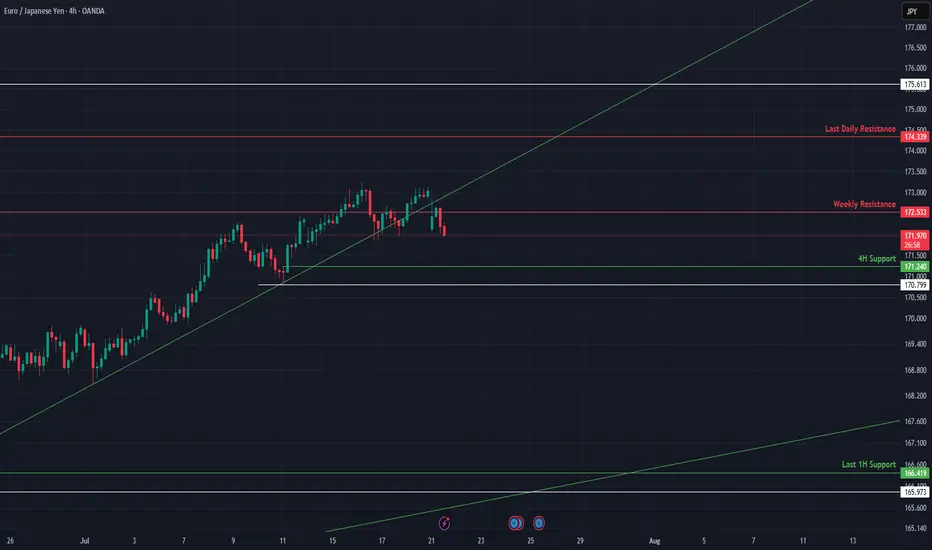
EURJPY is caught between a critical 4H support and weekly resistance, with momentum beginning to compress. The next move hinges on whether price holds the rising trendline or breaks beneath it. This update outlines the active structure, key levels, and macro narrative around JPY weakness.
🔍 Technical Analysis:
EURJPY recently rejected from weekly resistance at 172.53 and is now sitting on the 4H support at 171.24, right above an ascending trendline. The structure remains bullish while this trendline holds, but a breakdown below 170.77 would flip the bias.
On the upside, reclaiming 172.53 opens the path toward 174.33 (Last Daily Resistance). If support gives way, expect a drop toward 166.80 or lower.
🛡️ Support Zones (if pullback continues):
🟢 171.24 – 4H Support (High Risk)
Immediate support. Good for tight risk scalps.
Stop-loss: Below 170.77
🟡 166.89 – 165.27 – 1H Last Support (Medium Risk)
Strong historical base + diagonal confluence. Favorable for intraday or swing entries.
Stop-loss: Below 165.00
🔼 Resistance Levels:
🔴 172.53 – Weekly Resistance
Key rejection point. Break above this confirms upside continuation.
🔴 174.33 – Last Daily Resistance
Major supply zone. Bullish breakout target.
🧭 Outlook:
Bullish Case:
Hold above 171.24 and break 172.53 = upside continuation toward 174.33.
Bearish Case:
Break below 170.77 and failure to reclaim = possible slide toward 166.80 and below.
Bias:
Neutral–bullish while price holds above trendline. Flip bearish on close below 170.77.
🌍 Fundamental Insight:
JPY remains weak due to BoJ’s ultra-loose stance. However, intervention risk remains elevated if yen depreciation becomes disorderly. Euro remains supported by ECB’s hawkish tone and improving economic data. Watch for BOJ rhetoric and global yield shifts.
✅ Conclusion:
EURJPY is resting at a structural pivot between 4H support and weekly resistance. A breakout in either direction will likely determine the trend into August. Bulls must defend the trendline and 171.24 to stay in control.
Not financial advice. Like & follow for more high-probability setups across FX majors.
short eurjpysell eurjpy targetting 100% fib level as tp1. even though it is a weekly analysis, i dont intend to stay in it for more than a week
