EUR_JPY WILL GO UP|LONG|
✅EUR_JPY is trading along the rising support line
And as the pair is going up now
After the retest of the line
I am expecting the price to keep growing
To retest the supply levels above at 173.166
LONG🚀
✅Like and subscribe to never miss a new idea!✅
Disclosure: I am part of Trade Nation's Influencer program and receive a monthly fee for using their TradingView charts in my analysis.
JPYEUR trade ideas

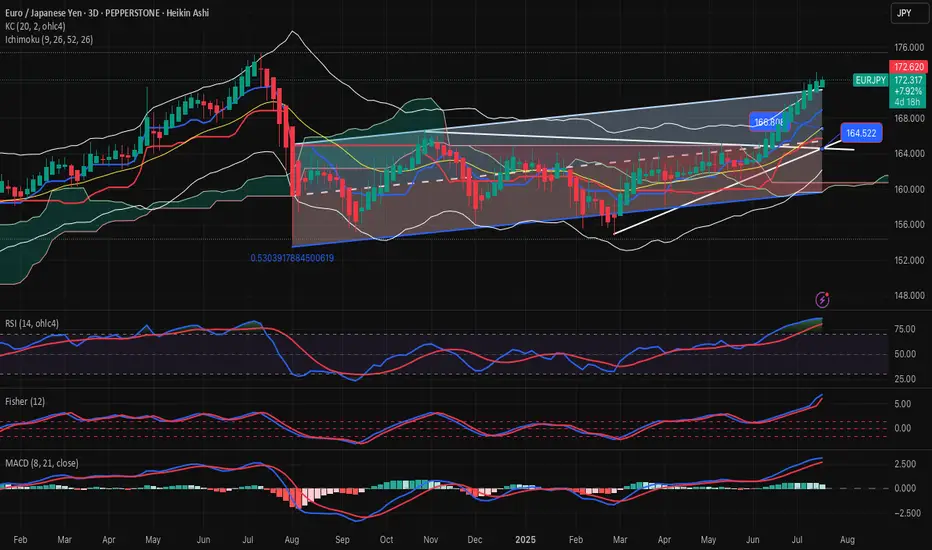
EURJPY-SELL strategy 3D chart Reg. ChannelThe pair is extremely overbought based on #D which means over time we likely see a recovery back to somewhere 168.00 area.
Strategy SELL @ 172.50-173.00 and take profit near 168.50 for now.
SELL EURJPYIn todays session we are monitoring EURJPY for selling opportunity. As seen eurjpy has been on a strong uptrend however 173 level has shown strong resistance and a willingness for market to go lower. Our entry is at 172.390 and stops are above 172.835 our target is 170.180 and lower. Use proper risk management cheers
EURJPY Buy now SETUPEURJPY Buy now SETUP based on LS on 4 hours chart, other measures shows strong market reversal area on lower TF. epected that market will touch atleast 50% of the Target :). what are your thoughts?

Sell eurjpyThis selling zone looking much strong
Daily and weekly already too overbought
6 continously weekly buy candels
Now bearish correction expected to change the trend
Wait for short time frame confirmation then enter into sell long term with minimum 700 pips target

Sell eurjpyStrong sell expected minimum 700 pips target
Already daily and weekly too much overbought

EURJPY ANALYSIS After seeing the previous daily candle close above key resistance of 172.500 ,we could see a retest of that support and a continuation to the upside

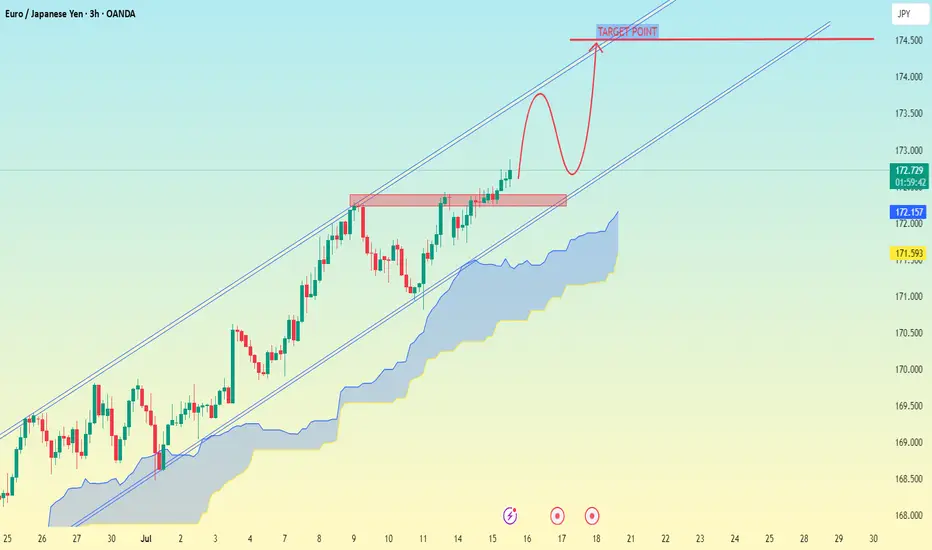
EUR/JPY (Euro vs Japanese Yen) on the 3-hour timeframeEUR/JPY (Euro vs Japanese Yen) on the 3-hour timeframe, the technical setup clearly suggests a bullish continuation inside an ascending channel, with a breakout above a consolidation zone.
---
🎯 Target Point (as marked on your chart):
Main Target Point: 174.500
---
🔍 Analysis Summary:
The price has broken above a resistance zone (around 172.700–172.900).
The chart shows a possible pullback and continuation setup (bullish flag/rounded retest).
The Ichimoku Cloud shows support below, suggesting bullish bias is intact.
The ascending channel remains unbroken and supports higher highs.
---
📌 Summary:
✅ Current Price Area: ~172.70
🥅 Target: 174.50
🔄 Potential Retest Zone: ~172.00–172.30 (marked in red box)
Would you like help with entry strategy, stop-loss placement, or trade management based on this setup?
EURJPY Bullish Setup: Waiting for the Optimal Retrace EntryThe EURJPY is currently in a strong bullish trend 📈🔥. I’m anticipating a retracement into the Fibonacci 50–61.8% zone 🔄, which aligns with the equilibrium of the current price swing ⚖️. This potential pullback could present an optimal entry 🎯 — provided we see a bullish break of market structure 🔓📊 during the move down.
🛑 Stops and targets, as discussed in the video, are shared for educational purposes only — this is not financial advice 📚🚫. Please ensure you do your own analysis and risk assessment 🧠📉.

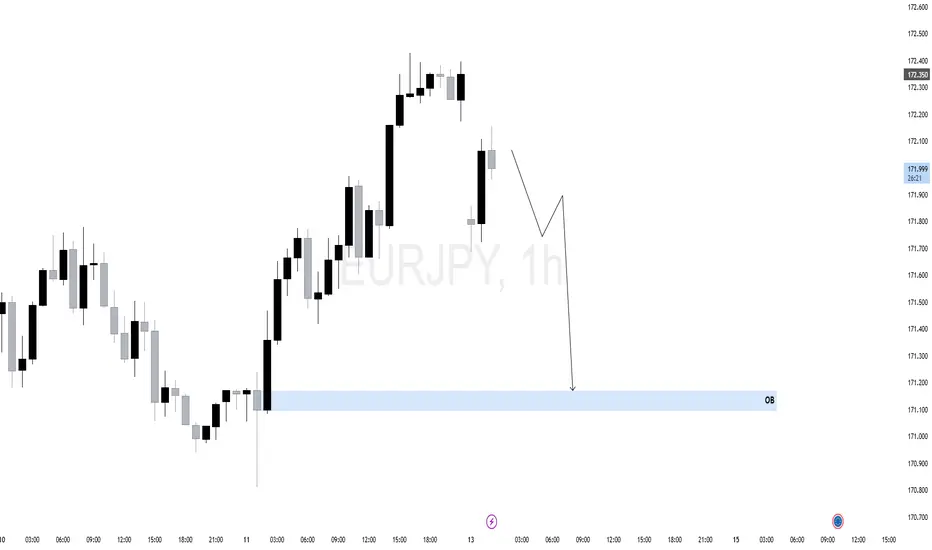
EURJPY SHORT – DAILY FORECAST Q3 | W29 | D15 | Y25💼 EURJPY SHORT – DAILY FORECAST
Q3 | W29 | D15 | Y25
📊 MARKET STRUCTURE SNAPSHOT
EURJPY is currently reacting from a key higher time frame supply zone, with price action showing weakness at premium levels. Structure and momentum are now aligning for a short opportunity backed by multi-timeframe confluence.
🔍 Confluences to Watch 📝
✅ Daily Order Block (OB)
Strong reaction and early signs of distribution.
Previous bullish momentum is losing steam; structure is flattening with rejection wicks forming.
✅ 4H Order Block
Break of internal structure (iBoS) confirms a short-term bearish transition.
✅ 1H Order Block
1H structure shift bearish
📈 Risk Management Protocols
🔑 Core principles:
Max 1% risk per trade
Only execute at pre-identified levels
Use alerts, not emotion
Stick to your RR plan — minimum 1:2
🧠 You’re not paid for how many trades you take, you’re paid for how well you manage risk.
🧠 Weekly FRGNT Insight
"Trade what the market gives, not what your ego wants."
Stay mechanical. Stay focused. Let the probabilities work.
🏁 Final Thoughts from FRGNT
📌 The structure is clear.
The confluences are stacked.
Let execution follow discipline, not emotion.

EURJPY IDEA After seeing the previous day close with bullish momentum we could expect continued push to the upside but since the 4hr is trading at a HH area a slight retrace could occur before the next bullish move to the upside

$EJ (EURJPY) 1HPrice has been in an overall bullish structure, forming higher highs and higher lows.
Price tapped into a premium zone, showing signs of exhaustion.
After the liquidity run, we saw a rejection from the top, followed by a shift in structure.
A bearish FVG has formed, and price has now retraced back into it, offering a potential sell opportunity.
As long as price holds below the high and inside the premium FVG zone, bearish bias is valid. Any break above the recent high would invalidate this setup.

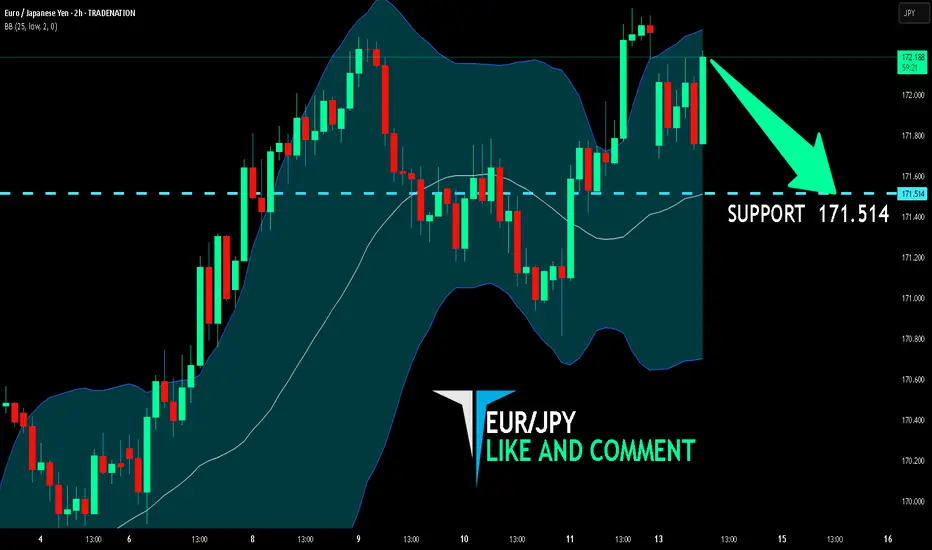
EUR/JPY BEST PLACE TO SELL FROM|SHORT
Hello, Friends!
EUR/JPY pair is trading in a local uptrend which we know by looking at the previous 1W candle which is green. On the 2H timeframe the pair is going up too. The pair is overbought because the price is close to the upper band of the BB indicator. So we are looking to sell the pair with the upper BB line acting as resistance. The next target is 171.514 area.
Disclosure: I am part of Trade Nation's Influencer program and receive a monthly fee for using their TradingView charts in my analysis.
✅LIKE AND COMMENT MY IDEAS✅
EURJPY SHORT – DAILY FORECAST Q3 | W29 | D14 | Y25 GAP SHORT!!!!💼 EURJPY SHORT – DAILY FORECAST
Q3 | W29 | D14 | Y25
📊 MARKET STRUCTURE SNAPSHOT
EURJPY is currently reacting from a key higher time frame supply zone, with price action showing weakness at premium levels. Structure and momentum are now aligning for a short opportunity backed by multi-timeframe confluence.
🔍 Confluences to Watch 📝
✅ Daily Order Block (OB)
Strong reaction and early signs of distribution.
Previous bullish momentum is losing steam; structure is flattening with rejection wicks forming.
✅ 4H Order Block
Break of internal structure (iBoS) confirms a short-term bearish transition.
✅ 1H Order Block
1H structure shift bearish
📈 Risk Management Protocols
🔑 Core principles:
Max 1% risk per trade
Only execute at pre-identified levels
Use alerts, not emotion
Stick to your RR plan — minimum 1:2
🧠 You’re not paid for how many trades you take, you’re paid for how well you manage risk.
🧠 Weekly FRGNT Insight
"Trade what the market gives, not what your ego wants."
Stay mechanical. Stay focused. Let the probabilities work.
🏁 Final Thoughts from FRGNT
📌 The structure is clear.
The confluences are stacked.
Let execution follow discipline, not emotion.

EURJPY ANALYSIS After seeing the previous weekly candle close bullish and the past few weeks pushing to the upside we could expect the momentum to continue into weekly highs of 175.000

$EJ (EURJPY) 1HEURJPY recently showed a strong bullish rally off a key 1H Order Block (OB) near 171.200. This rally swept sell-side liquidity before shifting short-term structure.
However, current price action shows signs of weakness — multiple rejection wicks near 172.350 and a potential shift in momentum.
The corrective structure forming suggests the bullish move may have been a liquidity run. A clean lower high may confirm bearish intent.
As long as price remains below the recent swing high, we anticipate a short-term retracement toward the OB zone (171.200), which aligns with an area of unfilled orders and possible rebalancing.
EURJPY: Clean Rejection Off the 200 EMAPrice tapped the 200 EMA and held.
Structure still bullish, no reason to flip bias just yet.
Let’s see if buyers can take it from here — nothing forced, just flow.

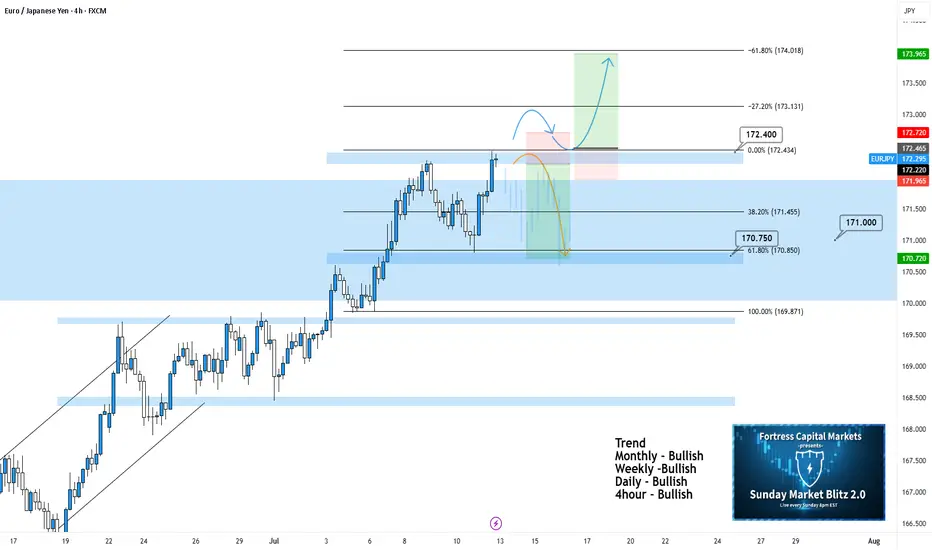
EURJPY 4hour TF - July 13th, 2025EURJPY 7/13/2025
EURJPY 4hour Bullish Idea
Monthly - Bullish
Weekly - Bullish
Daily - Bullish
4hour - Bullish
EJ has been paying out for the last couple weeks and the analysis has been spot on for these setups. Going into this week though we’re starting to get a bit uncertain. The fact that we’ve been in a rally since late June leaves me wondering how much more EJ has in it before a correction. So I think this week warrants some caution on EJ especially as we remain around this monthly 171.000 zone.
Let’s keep a look out for two potential scenarios going into this week:
Bullish Continuation - This is the most likely scenario and this idea lines up with all the major trends as well. For us to comfortably consider long setups I’d like to see a clear break above 172.400 zone / our 0% fib level followed by a retest for confirmation. This is what we would like to see but keep in mind price action has been moving aggressively and may not provide a retest.
Bearish Reversal into Range - This is a possibility but could also be a sign of consolidation around 171.000. There may be a decent short opportunity if we see the right kind of rejection/reversal from 172.400. In this scenario, it looks like this would be a potential range trade and I wouldn’t try to repeat this setup more than once.
EURJPY – Breakout Retest Trade | TCB Strategy ExecutionEURJPY – Breakout Retest Trade | TCB Strategy Execution
📍 Pair: EURJPY
🕒 Timeframe: 4H
📅 Date: July 13, 2025
📈 Strategy: TCBFlow (Trend → Countertrend → Breakout)
🔹 Market Context:
EURJPY is maintaining bullish structure within a rising trend channel. After a corrective dip, price has reclaimed structure above 171.550–171.640 and broken above resistance with momentum.
This move creates a potential retest buy opportunity, targeting the 174.00 region as part of a breakout continuation.
✅ TCB Breakdown:
Trend: Clear bullish channel holding
Countertrend: Short pullback into structure demand
Breakout: Price broke above minor resistance (171.640–172.338)
🎯 Trade Idea:
Buy Zone: 171.640–171.552 (retest of breakout)
SL: Below 171.20
TP Target: 174.000 zone (measured move + expansion target)
📊 Checklist Score: 90–95%
✅ Clean trend structure
✅ Valid countertrend breakout
✅ Momentum break with potential NY retest

EURJPY: Bullish Trend ContinuationPrice remains in a strong uptrend, now trading above the 172.00 psychological level, targeting new liquidity above.
D1 Key Levels:
Support: 170.50 – 171.00 (daily demand zone + origin of breakout)
Resistance: Hasn't found a ceiling yet. Next key levels are psychological round numbers (173.00, 174.00).
H4 Demand Zone (Pullback Area): 171.20 – 171.50
Watch for retracement into this zone for a high-probability buy setup.
H1 OB: 171.30 – 171.50 (clean mitigation zone)
Monitor M15 for bullish BOS after price taps into this zone for confirmation.
M15 Optimal Plan:
Wait for pullback into 171.30–171.50
Confirm entry with M15 bullish BOS + displacement
🟢Entry Zone: 171.30 – 171.50 (after confirmation)
SL: 170.90
TP1: 172.80
TP2: 173.50
TP3: 174.20
Breakout Alternative: If price rallies above 172.80 early in the week, look for a breakout entry on retest.
Invalidation: H4 closes below 170.50

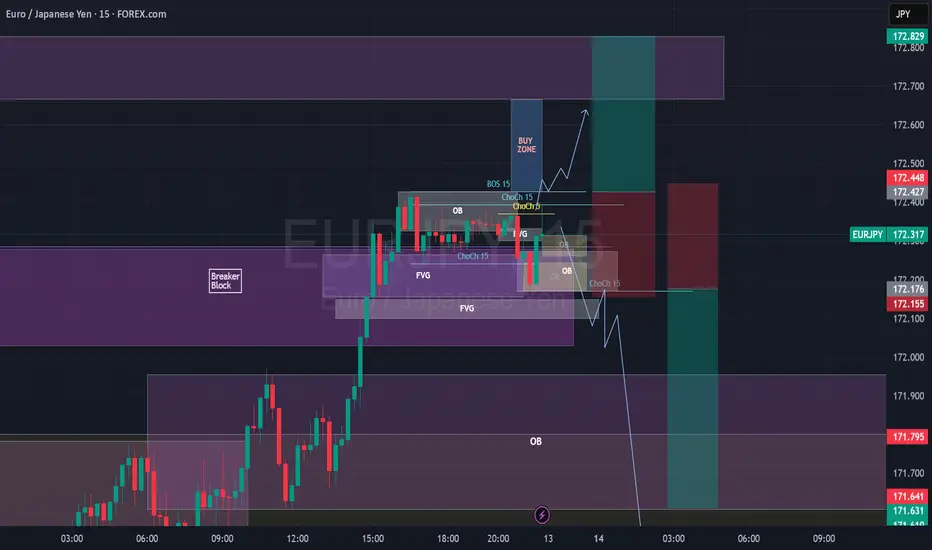
EURJPY Break of Structure, Retest and Fly5m - Monthly timeframes Bullish.
Price body candle closed and retested a 1H BB on 1H Timeframe.
Also retesting a 5M Bullish OB.
I want to wait for price to body candle close above the 15m BoS, create 3m/5m ChoCh, retest and look for Buys towards 172.665 (at the 1H OB or potentially 172.829, top of the 1H OB. SL under the 15m ChoCh.
EURJPY–trend continuation, engulfing candle .. the week of 14/07Friday’s candle engulfed 2 previous days of price action. I interpret this as strongly bullish, especially since this happened in an already nicely bullish trend. However, the room to the upside it not unlimited - the ATH is at 175.421. We are likely to see sideways price action there due to some profit taking and maybe even some selling. IMO there are 2 possible options to get a 2R return:
- we may get a pullback before the bullish trend resumes.
- we drop down to the H1 chart and look for an opportunity to go long.
Either way, in my opinion, the trade should be closed before the ATH.
This is not a trade recommendation; it’s merely my own analysis. Trading carries a high level of risk so carefully managing your capital and risk is important. If you like my idea, please give a “boost” and follow me to get even more.

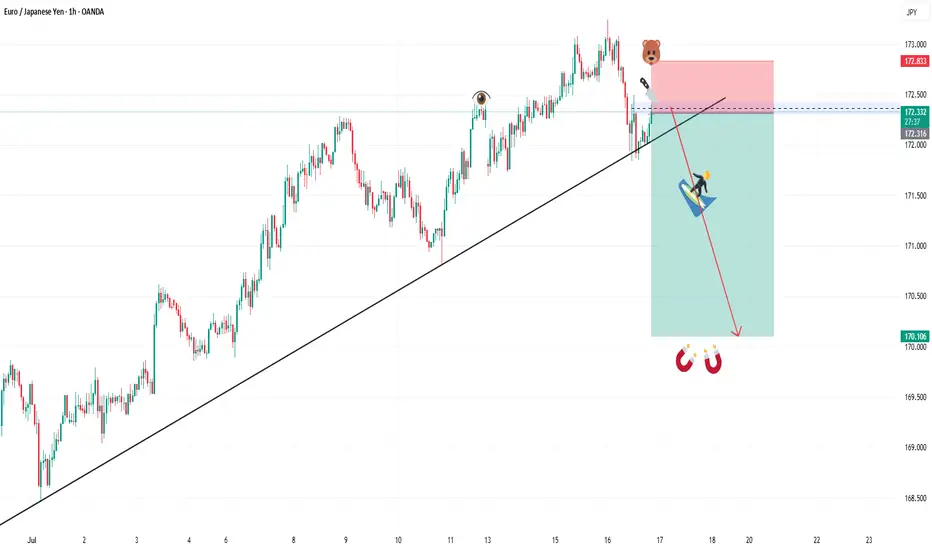
Potential Short Opportunity on EURJPYReasons I think this pair will fall:
- Confirmed Trend line means harder break out.
- RSI was overbought on the 4H time frame
- Potential double top
What do you think?
